

Toward Consistent Methodology to Quantify Populations in Proximity to Oil and Gas Development: A National Spatial Analysis and Review
- PMID: 28858829
- PMCID: PMC5783652
- DOI: 10.1289/EHP1535
Toward Consistent Methodology to Quantify Populations in Proximity to Oil and Gas Development: A National Spatial Analysis and Review
Abstract
Background: Higher risk of exposure to environmental health hazards near oil and gas wells has spurred interest in quantifying populations that live in proximity to oil and gas development. The available studies on this topic lack consistent methodology and ignore aspects of oil and gas development of value to public health-relevant assessment and decision-making.
Objectives: We aim to present a methodological framework for oil and gas development proximity studies grounded in an understanding of hydrocarbon geology and development techniques.
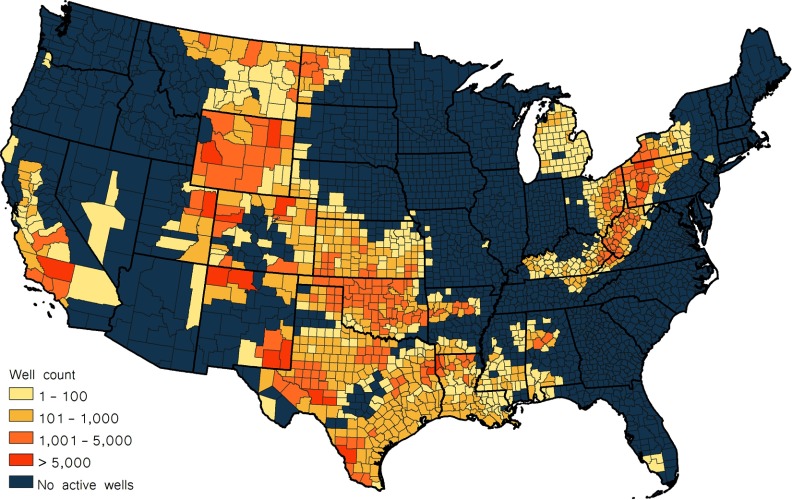
Methods: We geospatially overlay locations of active oil and gas wells in the conterminous United States and Census data to estimate the population living in proximity to hydrocarbon development at the national and state levels. We compare our methods and findings with existing proximity studies.
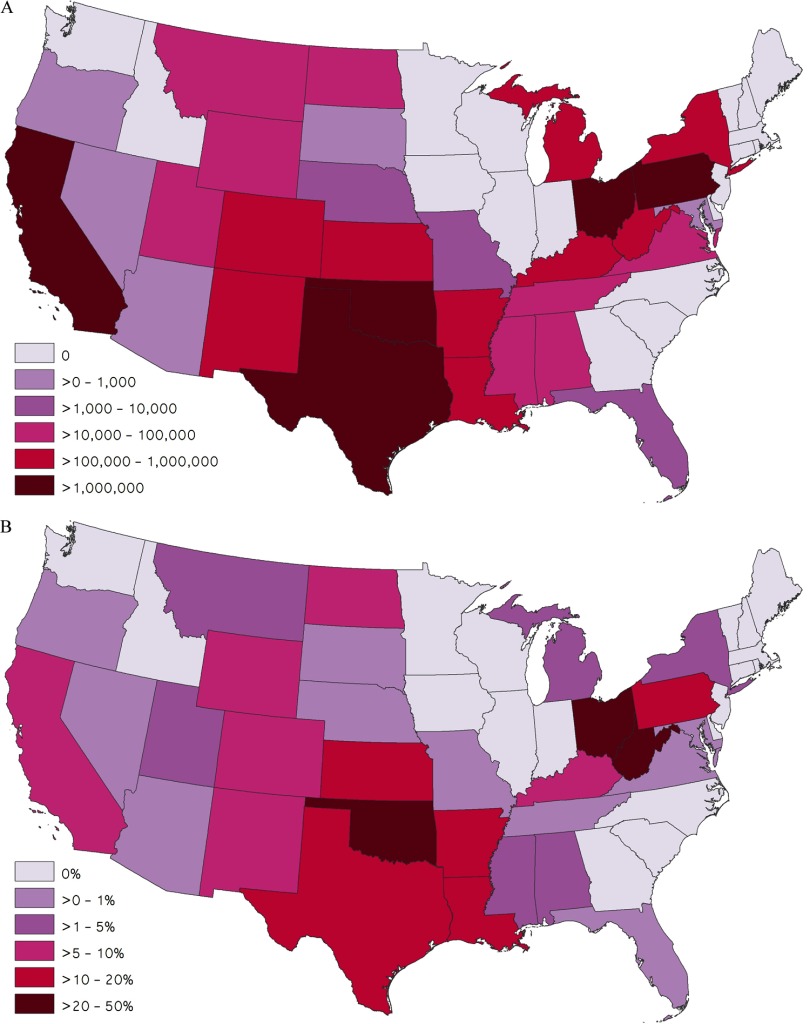
Results: Nationally, we estimate that 17.6 million people live within 1,600m (∼1 mi) of at least one active oil and/or gas well. Three of the eight studies overestimate populations at risk from actively producing oil and gas wells by including wells without evidence of production or drilling completion and/or using inappropriate population allocation methods. The remaining five studies, by omitting conventional wells in regions dominated by historical conventional development, significantly underestimate populations at risk.
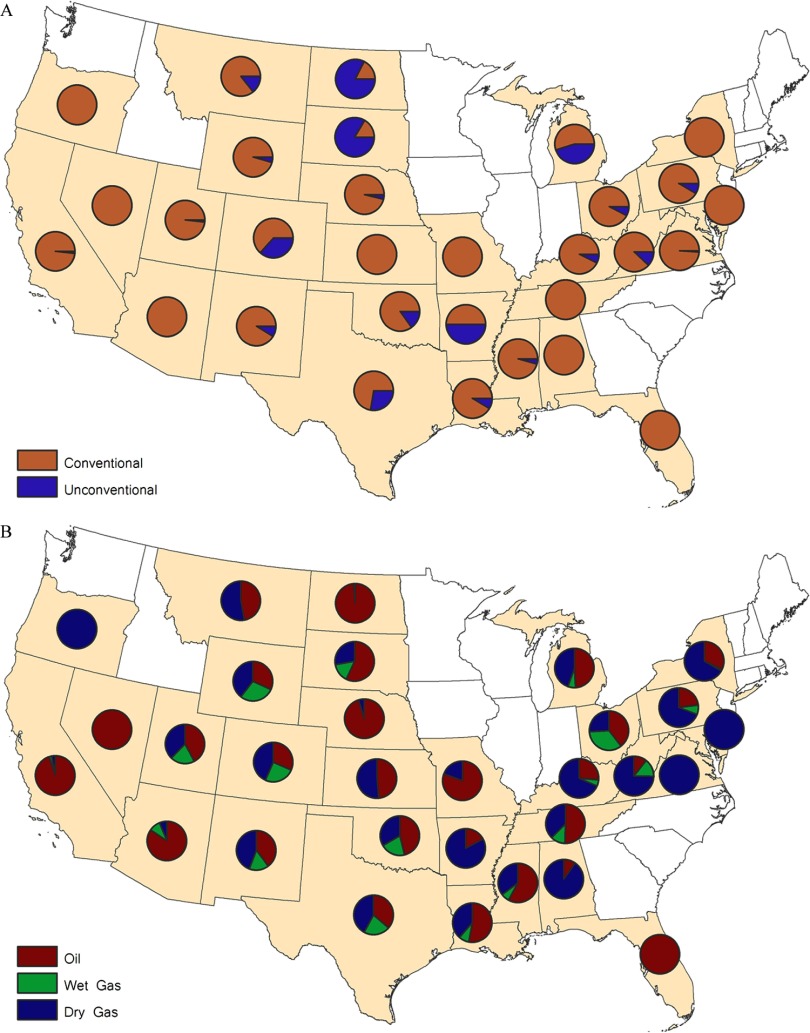
Conclusions: The well inventory guidelines we present provide an improved methodology for hydrocarbon proximity studies by acknowledging the importance of both conventional and unconventional well counts as well as the relative exposure risks associated with different primary production categories (e.g., oil, wet gas, dry gas) and developmental stages of wells. https://doi.org/10.1289/EHP1535.
Figures
Comment in
-
In the Neighborhood of 18 Million: Estimating How Many People Live Near Oil and Gas Wells.Environ Health Perspect. 2017 Dec 7;125(12):124003. doi: 10.1289/EHP2553. Environ Health Perspect. 2017. PMID: 29225196 Free PMC article. No abstract available.
References
-
- Brown DR, Lewis C, Weinberger BI. 2015. Human exposure to unconventional natural gas development: A public health demonstration of periodic high exposure to chemical mixtures in ambient air. J Environ Sci Health A Tox Hazard Subst Environ Eng 50(5):460–472, 10.1080/10934529.2015.992663. - DOI - PubMed
-
- CalEPA (California Environmental Protection Agency). 2016. OEHHA Acute, 8-Hour and Chronic Reference Exposure Level (REL) Summary. OEHHA. https://oehha.ca.gov/air/general-info/oehha-acute-8-hour-and-chronic-ref... [accessed 19 April 2017].
Publication types
MeSH terms
Substances
LinkOut - more resources
Full Text Sources
Other Literature Sources
Medical