. 2017 Aug 31;13(8):e1006998.
doi: 10.1371/journal.pgen.1006998. eCollection 2017 Aug.

Flavin monooxygenases regulate Caenorhabditis elegans axon guidance and growth cone protrusion with UNC-6/Netrin signaling and Rac GTPases

Affiliations

Flavin monooxygenases regulate Caenorhabditis elegans axon guidance and growth cone protrusion with UNC-6/Netrin signaling and Rac GTPases

Mahekta R Gujar et al. PLoS Genet. .

Abstract

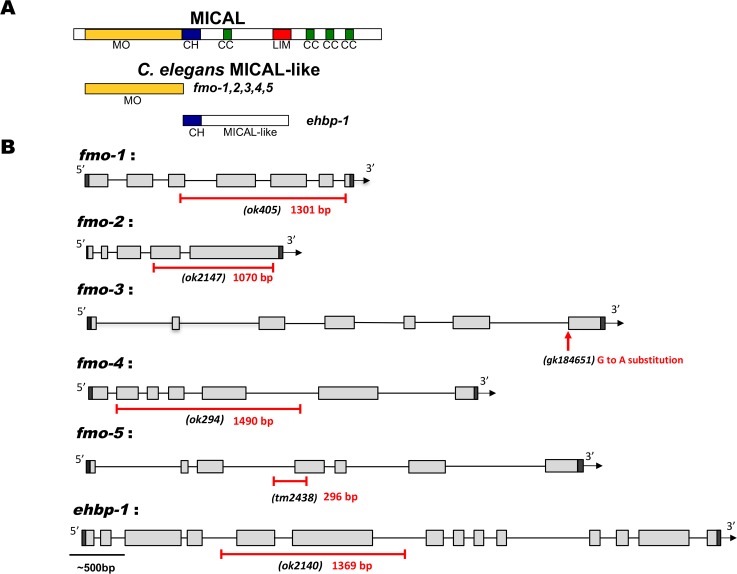
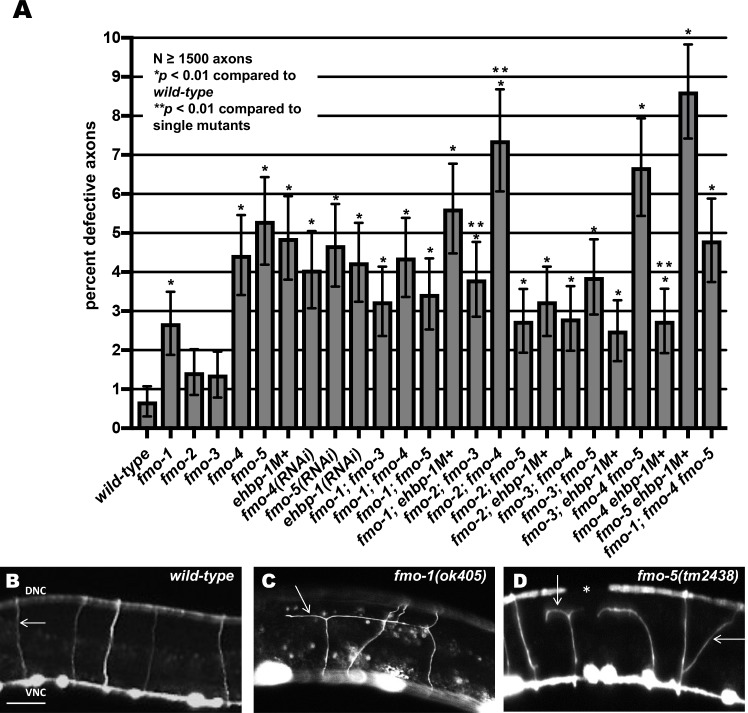
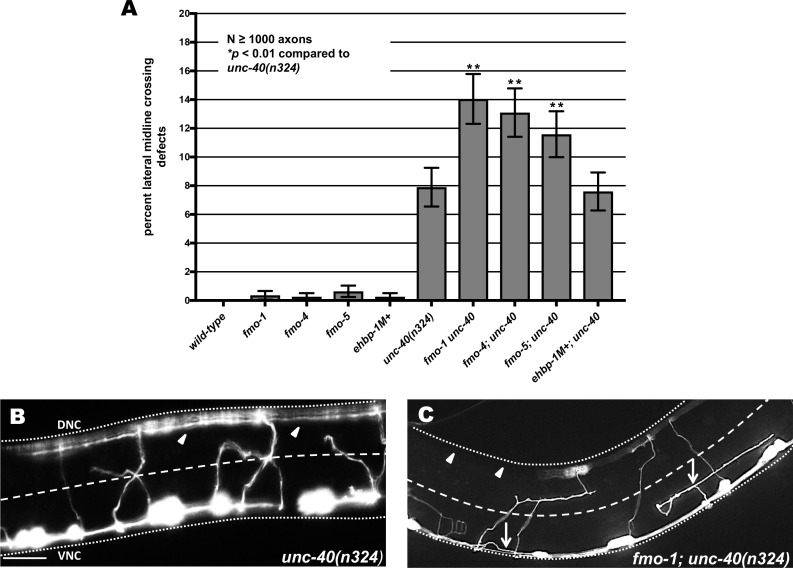
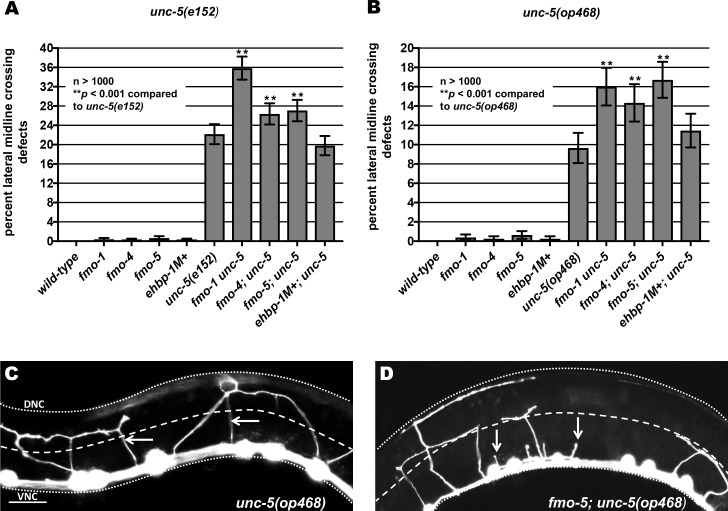
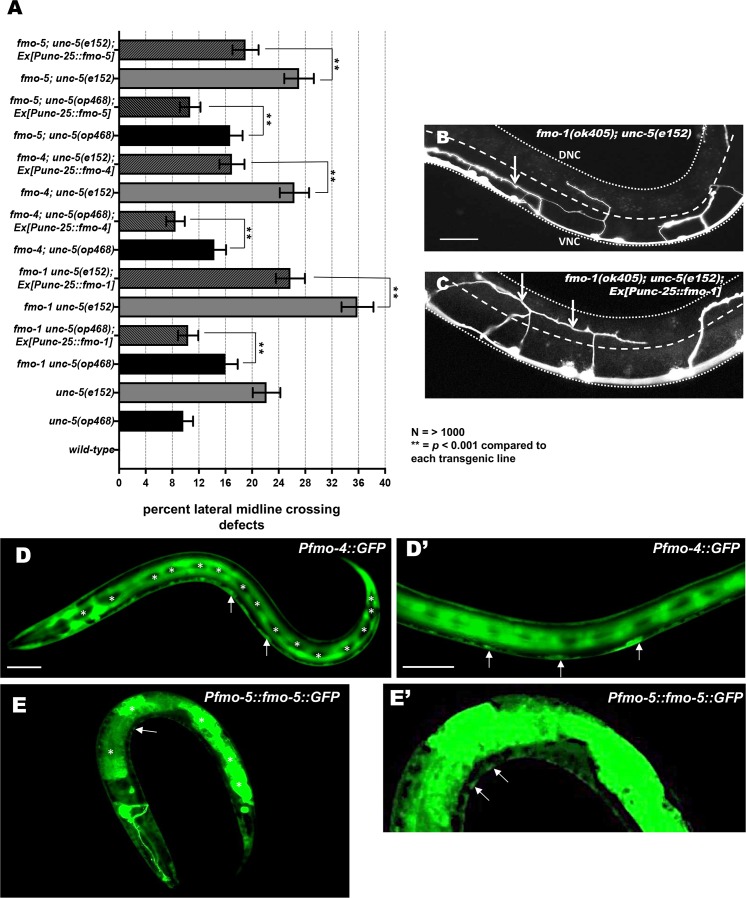
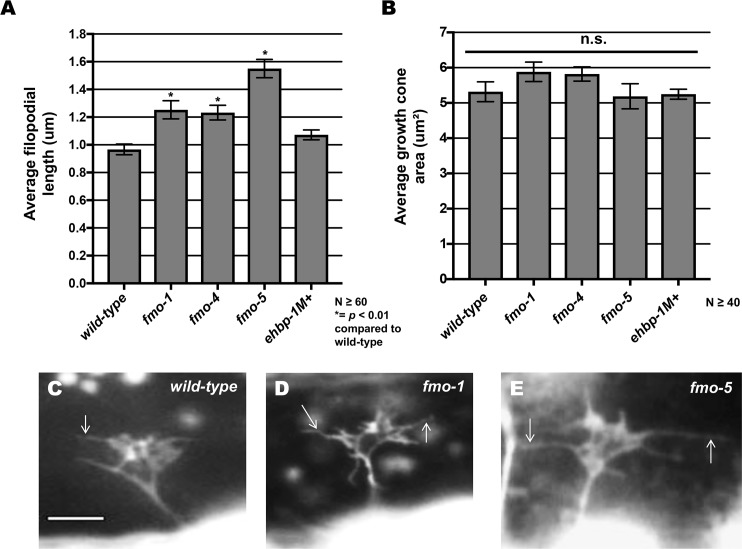
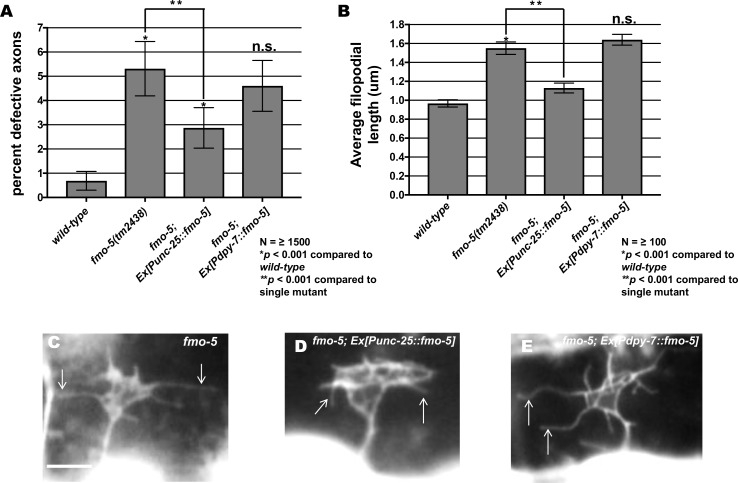
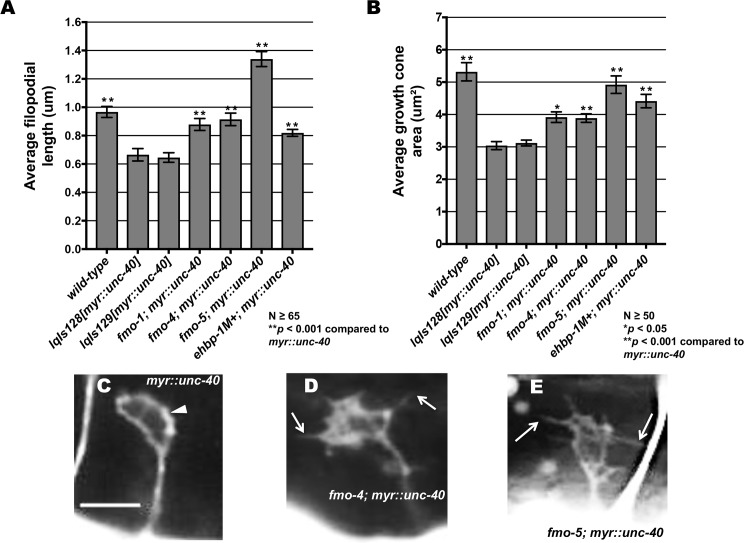
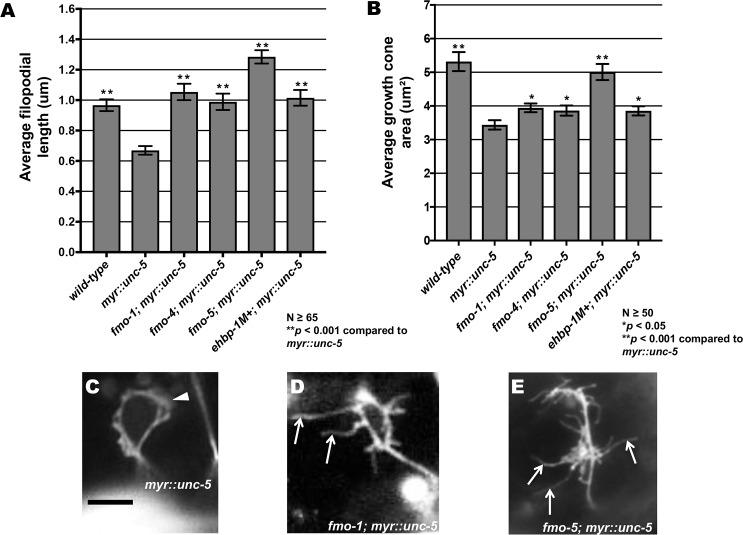
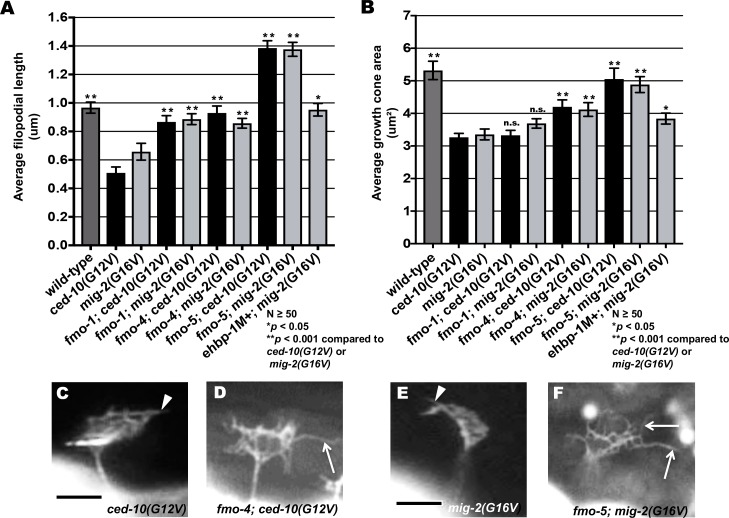
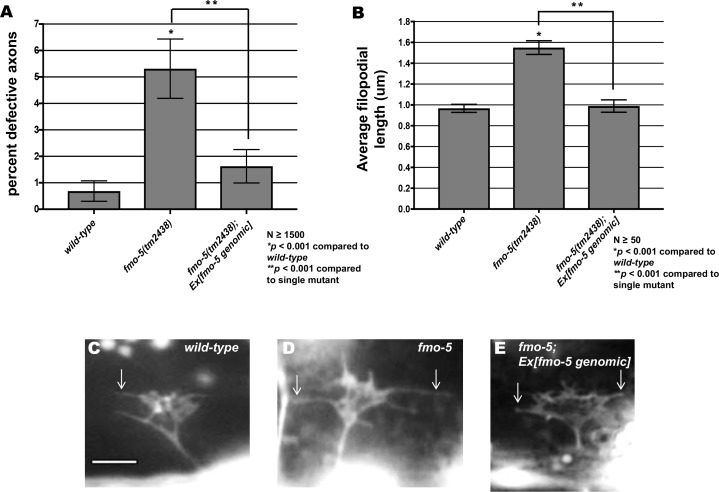
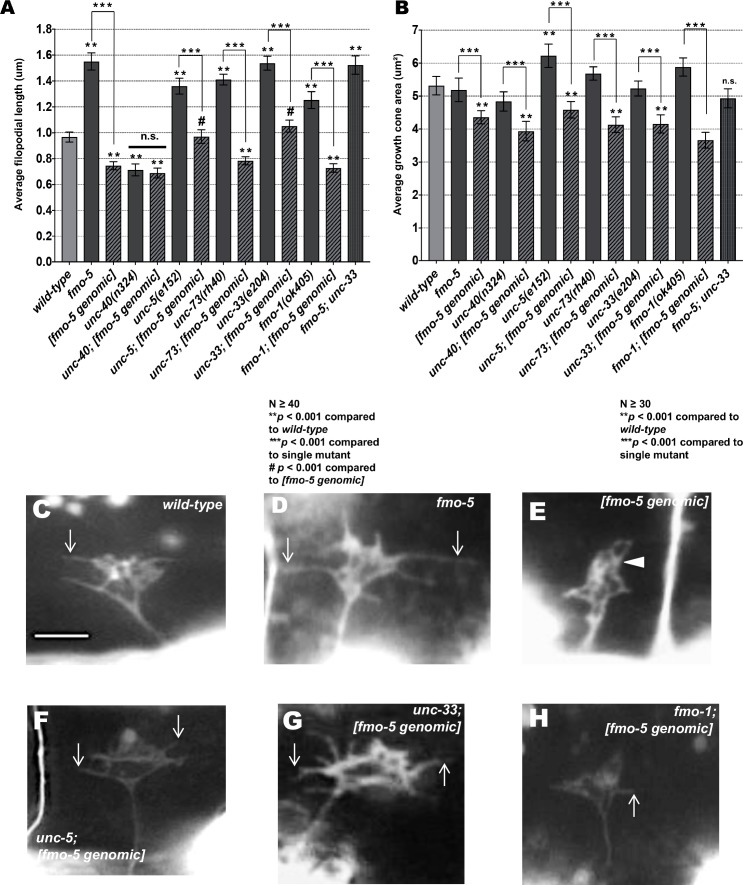
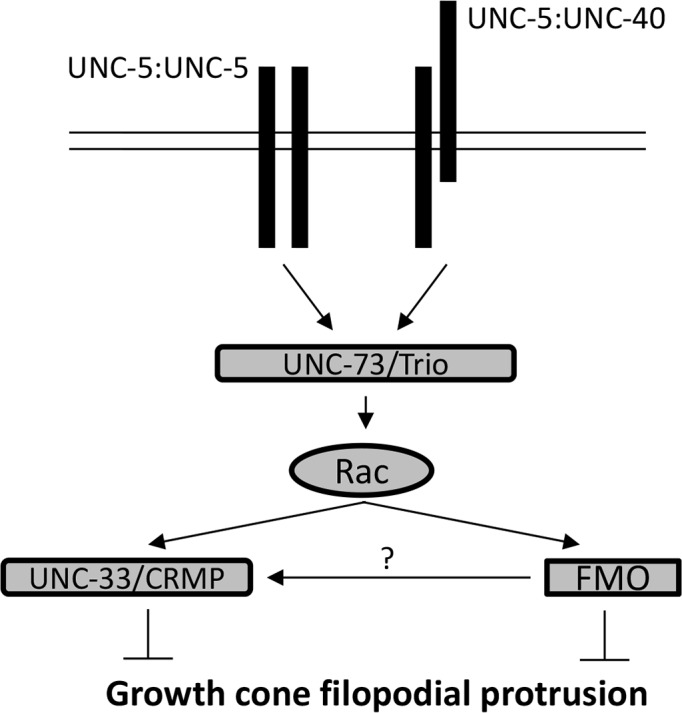
The guidance cue UNC-6/Netrin regulates both attractive and repulsive axon guidance. Our previous work showed that in C. elegans, the attractive UNC-6/Netrin receptor UNC-40/DCC stimulates growth cone protrusion, and that the repulsive receptor, an UNC-5:UNC-40 heterodimer, inhibits growth cone protrusion. We have also shown that inhibition of growth cone protrusion downstream of the UNC-5:UNC-40 repulsive receptor involves Rac GTPases, the Rac GTP exchange factor UNC-73/Trio, and the cytoskeletal regulator UNC-33/CRMP, which mediates Semaphorin-induced growth cone collapse in other systems. The multidomain flavoprotein monooxygenase (FMO) MICAL (Molecule Interacting with CasL) also mediates growth cone collapse in response to Semaphorin by directly oxidizing F-actin, resulting in depolymerization. The C. elegans genome does not encode a multidomain MICAL-like molecule, but does encode five flavin monooxygenases (FMO-1, -2, -3, -4, and 5) and another molecule, EHBP-1, similar to the non-FMO portion of MICAL. Here we show that FMO-1, FMO-4, FMO-5, and EHBP-1 may play a role in UNC-6/Netrin directed repulsive guidance mediated through UNC-40 and UNC-5 receptors. Mutations in fmo-1, fmo-4, fmo-5, and ehbp-1 showed VD/DD axon guidance and branching defects, and variably enhanced unc-40 and unc-5 VD/DD axon guidance defects. Developing growth cones in vivo of fmo-1, fmo-4, fmo-5, and ehbp-1 mutants displayed excessive filopodial protrusion, and transgenic expression of FMO-5 inhibited growth cone protrusion. Mutations suppressed growth cone inhibition caused by activated UNC-40 and UNC-5 signaling, and activated Rac GTPase CED-10 and MIG-2, suggesting that these molecules are required downstream of UNC-6/Netrin receptors and Rac GTPases. From these studies we conclude that FMO-1, FMO-4, FMO-5, and EHBP-1 represent new players downstream of UNC-6/Netrin receptors and Rac GTPases that inhibit growth cone filopodial protrusion in repulsive axon guidance.


Conflict of interest statement

The authors have declared that no competing interests exist.

Figures

Fig 1
Fig 1. fmo genes and ehbp-1.
(A) Diagram of Drosophila MICAL, the C. elegans flavin monooxygenases (FMOs), and C. elegans EHBP-1. MO, flavin monooxygenase domain; CH-calponin homology domain, CC, coiled-coiled domain; LIM, LIM domain. (B) The structures of the fmo-1, fmo-2, fmo-3, fmo-4, fmo-5 and ehbp-1 genes are shown. Filled boxes represent exons. The extent of deletions in fmo-1, fmo-2, fmo-4, fmo-5 and ehbp-1 are shown below the structure, indicated by a red line. The red arrow points to the region of the splice site mutation in fmo-3. Scale bar indicates 500bp.
Fig 2
Fig 2. VD/DD motor neurons and axons in C. elegans.
(A) Diagram of an early L2 larval C. elegans hermaphrodite highlighting the position and structure of the DD motor neurons (red) and axons (black). Anterior is to the left, and dorsal is up. The blue lines represent the ventral and dorsal muscle quadrants. In the early L2 larval stage, the VD neurons (green) extend axons anteriorly in the ventral nerve cord after which the axons turn dorsally and migrate to the dorsal nerve cord to form commissures. Only two of the 13 VD neurons are shown. While migrating towards the dorsal nerve cord, VD growth cones display an extended, protrusive morphology with highly dynamic filopodial protrusions (VD8). VD7 shows the final structure of the VD neurite. (B) Fluorescent micrograph of an early L2 larval wild-type commissure indicated by an arrow, and a VD growth cone indicated by an arrowhead. CB, cell body; DNC, dorsal nerve cord; and VNC, ventral nerve cord. Scale bar represents 5μm. (C) Diagram of an L4 hermaphrodite after all the VD axon outgrowth is complete. The 18 commissures on the right side of the animal are shown (black lines), and axon guidance defects of these commissures were scored. One commissure (VD1) extends on the right side and was not scored. Of the 18 commissures on the right side, two (DD1 and VD2) extend as a single fascicle. Others pairs occasionally extended as single fascicles as well, resulting in an average of 16 observable commissures per wild-type animal.
Fig 3
Fig 3. Mutations in fmo-1, fmo-4, fmo-5 and ehbp-1 cause axon pathfinding defects.
(A) Percentage of VD/DD axons with pathfinding defects (see Materials and Methods) in single mutants, double mutants and triple mutant harboring the juIs76[Punc-25::gfp] transgene. Single asterisks (*) indicate the significant difference between wild-type and the mutant phenotype (p < 0.01); Double asterisks (**) indicate significant difference between double mutants and the predicted additive effect of single mutants (p < 0.01) determined by Fischer’s exact test. Error bars represent 2x standard error of proportion. (B-D) Representative fluorescent micrograph of L4 VD/DD axons. Anterior is to the left, and dorsal is up. The scale bar represents 5μm. DNC, dorsal nerve cord; and VNC, ventral nerve cord. (B) A wild-type commissure is indicated by an arrow. (C) An fmo-1(ok405) commissure branched and failed to reach to dorsal nerve cord (arrow). (D) fmo-5(tm2438) VD/DD axons branched and wandered (arrows). A gap in the dorsal nerve cord (asterisk) indicates that commissural processes failed to reach the dorsal nerve cord. determined by Fischer’s exact test. At least 1500 axons were scored per genotype. M+ indicates that the animal has wild-type maternal ehbp-1(+) activity.
Fig 4
Fig 4. Axon pathfinding defects in unc-40(n324) are enhanced by loss of fmo-1, fmo-4 and fmo-5.
(A) Percentage of VD/DD axons that failed cross the lateral midline of L4 hermaphrodites. Error bars represent 2x standard error of the proportion; double asterisks (**) indicates a significant difference between unc-40(n324) alone and the double mutants (p < 0.001) determined by Fisher’s exact test. Only axon commissures visibly emanating from the ventral nerve cord were scored. (B,C) Representative images showing VD/DD axons (arrows) after their complete outgrowth in L4 animals. The lateral midline of the animal is indicated by the dashed white line. The dorsal nerve cord and ventral nerve cord are indicated by a dotted white line. Dorsal is up, anterior is to the left. Scale bar represents 5μm. (B) In unc-40(n324), many axons extend past the lateral midline, as evidenced by axons in the dorsal nerve cord (arrowheads). (C) In fmo-1(ok405); unc-40(n324), an increased number of axons did not cross the midline resulting in extensive regions of dorsal nerve cord without axons (arrowheads). Arrowhead indicates large gaps in the dorsal nerve cord.
Fig 5
Fig 5. Axon pathfinding defects of hypomorphic unc-5 mutants are enhanced by loss of fmo-1 and fmo-4.
(A) and (B) Quantification of VD/DD axons that failed to cross the lateral midline of L4 hermaphrodites in hypomorphic unc-5(e152) and unc-5(op468) mutants alone and in double mutant animals. Error bars represent 2x standard error of the proportion; double asterisks (**) indicates a significant difference between unc-5(e152) or unc-5(op468) alone and the double mutants (p < 0.001) determined by Fisher’s exact test. Only visible commissural processes emanating from the ventral nerve cord were scored. (C,D) Fluorescence micrographs of VD/DD axons (arrows) in L4 hermaphrodites. The lateral midline of the animal is indicated by the dashed white line. The dorsal nerve cord and ventral nerve cord are indicated by dotted white lines. Dorsal is up, anterior is to the left. Scale bar represents 5μm. (C) In the weak loss of function unc-5(op468) mutants, axons crossing the lateral midline are indicated (arrows). (D) In fmo-5(tm2438); unc-5(op468), some axons cross the lateral midline, but many terminate before crossing the lateral midline (arrows).
Fig 6
Fig 6. Expression of fmo-1, fmo-4 and fmo-5 in VD/DD neurons rescues axon pathfinding defects.
(A) The percentages of VD/DD axons failing to cross the lateral mid-line are as described in Fig 5A. unc-5 double mutant genotypes are indicated, and the Punc-25::fmo-1, Punc-25::fmo-4, and Punc-25::fmo-5 transgenes are bracketed. Data for transgenic strains are the combined results from three independently-derived transgenes with similar effects. Double asterisks (**) indicate a significant difference between the double mutant and the transgenic strain (p <0.001; Fisher’s exact test). Error bars represent 2x standard error of the proportion. (B, C) Micrographs of mutant and rescued animals. Dorsal is up, anterior to the left. Scale bar represents 5μm. The lateral midline of the animal is indicated by the dashed white line. The dorsal nerve cord and ventral nerve cord are indicated by dotted white lines. (B) fmo-1(ok405) unc-5(e152) axons often fail to cross the lateral midline (arrow). (C) fmo-1(ok405) unc-5(e152); Ex(Punc-25::fmo-1) axons crossed the lateral midline (arrows). (D-E and D’-E’) Images are micrographs of L2 animals with transgenic expression of Pfmo-4::gfp and Pfmo-5::fmo-5::gfp. Dorsal is up and anterior is left. Scale bar: 5μm. (D) fmo-4::gfp is broadly expressed, including in hypodermis and in cells along the ventral nerve cord that resemble motor neurons. Expression is not evident in the lateral hypodermal seam cells (asterisks). (D’) Enlarged image of fmo-4::gfp expression in ventral nerve cord cells (arrows). (E). fmo-5::gfp is expressed strongly in the gut (asterisks), as well as in cells along the ventral nerve cord. (arrow) (E’) Enlarged image of fmo-5::gfp expression in ventral nerve cord cells (arrows).
Fig 7
Fig 7. Mutations in fmo-1, fmo-4 and fmo-5 increase VD growth cone filopodial length.
(A,B) Quantification of VD growth cone filopodial length and growth cone area in wild-type and mutant animals. (A) Average filopodial length, in μm. (B) Growth cone area in μm2. Error bars represent 2x standard error of the mean; asterisks indicate the significant difference between wild-type and the mutant phenotype (*p < 0.01) determined by two-sided t-test with unequal variance. n.s., not significant. (C-E) Fluorescence micrographs of VD growth cones; (C) A wild-type VD growth cone. (D) fmo-1(ok405) and (E) fmo-5(tm2438) growth cones showing increased filopodial protrusion in the form of longer filopodia. Arrows indicate representative filopodia. Scale bar: 5μm.
Fig 8
Fig 8. Expression of fmo-5 in VD/DD neurons rescues axon pathfinding defects and growth cone filopodial protrusion.
(A) Rescue of fmo-5(tm2438) VD/DD axons by transgenes expressing fmo-5 under the unc-25 promoter (Ex[Punc-25(fmo-5)]). Data for transgenic arrays are the combined results from three independently-derived arrays with similar effects. Single asterisks (*) indicate a significant difference between wild type and the mutant (p < 0.001); Double asterisks (**) indicates a significant difference between the mutant and rescuing transgene (p < 0.001) determined by two-sided t-test with unequal variance. (B) Rescue of fmo-5(tm2438) VD growth cone filopodial length by transgenes expressing fmo-5 under the unc-25 promoter (Ex[Punc-25(fmo-5)]). Average lengths of filopodial protrusions are shown (μm). Error bars represent 2x standard error of the mean. Data for transgenic arrays are the combined results from three independently-derived arrays with similar effects. Single asterisks (*) indicate a significant difference between wild type and the mutant (p < 0.001); Double asterisks (**) indicates a significant difference between the mutant and rescuing transgene (p < 0.001) determined by two-sided t-test with unequal variance. n.s., not significant. (C-E) Fluorescence micrographs of VD growth cones in fmo-5(tm2438), fmo-5(tm2438); Ex[Punc-25::fmo-5] and fmo-5(tm2438); Ex[Pdpy-7::fmo-5] which showed no rescue. Arrows indicate representative filopodia. Scale bar: 5μm.
Fig 9
Fig 9. FMO-1, FMO-4, FMO-5, and EHBP-1 are required for MYR::UNC-40-mediated inhibition of VD growth cone protrusion.
(A,B) Quantification of VD growth cone filopodial length and growth cone area in wild-type, myr::unc-40 (lqIs128 and lqIs129) and double mutants. (A) Average filopodial length, in μm. (B) Growth cone area in μm2. Error bars represent 2x standard error of the mean. Asterisks indicate significant difference between myr::unc-40, wild-type and the double mutants (*p < 0.05, ** p < 0.001) determined by two-sided t-test with unequal variance. (C-E) Fluorescent micrographs of mutant VD growth cones; (C) Image of a myr::unc-40 growth cone in an early L2 animal. The arrowhead points to a growth cone with little or no filopodial protrusion. (D, E) Images of fmo-4(ok294); myr::unc-40 and fmo-5(tm2438); myr::unc-40 growth cones. Filopodial protrusions are indicated (arrows). Scale bar: 5μm. fmo-1(ok405); myr::unc-40 double mutants were built and compared with lqIs129[myr::unc-40] due to the linkage of the lqIs128 transgene.
Fig 10
Fig 10. FMO-1, FMO-4, FMO-5, and EHBP-1 are required for MYR::UNC-5-mediated inhibition of VD growth cone protrusion.
(A,B) Quantification of VD growth cone filopodial length and growth cone area in wild-type, myr::unc-5, and double mutants. (A) Average filopodial length, in μm. (B) Growth cone area in μm2. Error bars represent 2x standard error of the mean. Asterisks indicate significant difference between myr::unc-5 and the double mutants (*p < 0.05, **p < 0.001) determined by two-sided t-test with unequal variance. (C-E) Representative fluorescent micrographs of mutant VD growth cones; (C) Image of a myr::unc-5 growth cone in an early L2 animal. The arrowhead points to a growth cone with limited protrusion. (D, E) Images of fmo-1(ok405); myr::unc-5 and fmo-5(tm2438); myr::unc-5 growth cones. Arrows point to filopodial protrusions. Scale bar: 5μm.
Fig 11
Fig 11. FMO-1, FMO-4 and EHBP-1 are required for Rac GTPase-mediated inhibition of VD growth cone protrusion.
(A,B) Quantification of VD growth cone filopodial length and growth cone area in wild-type, activated ced-12(G12V) and mig-2(G16V), and double mutants. (A) Average filopodial length, in μm. (B) Growth cone area in μm2. Error bars represent 2x standard error of the mean. Asterisks indicate significant difference between ced-10(G12V) mig-2(G16V) and their respective double mutants (*p < 0.05, **p < 0.001) determined by two-sided t-test with unequal variance. n.s., not significant. (C-F) Representative fluorescent micrographs of mutant VD growth cones. (C,D) Images of ced-10(G12V) and fmo-4(ok294); ced-10(G12V) growth cones. The arrowhead in (C) points to a growth cone with limited protrusion, and the arrow in (D) indicates a filopodial protrusion. (E,F) Images of mig-2(G16V) and fmo-5(tm2438); mig-2(G16V) growth cones. The arrowhead in (E) points to a growth cone with limited protrusion, and the arrow in (F) indicates a filopodial protrusion. Scale bar: 5μm.
Fig 12
Fig 12. FMO-5 can inhibit growth cone filopodial protrusion.
(A) Rescue of fmo-5(tm2438) VD/DD axons by transgenes containing genomic fmo-5 (Ex[fmo-5 genomic]). Data for transgenic arrays are the combined results from three independently-derived arrays with similar effects. Single asterisks (*) indicate a significant difference between wild type and the mutant (p < 0.001); Double asterisks (**) indicates a significant difference between the mutant and rescuing transgene (p < 0.001) determined by two-sided t-test with unequal variance. (B) Rescue of fmo-5(tm2438) VD growth cone filopodial protrusions by transgenes containing genomic fmo-5 (Ex[fmo-5 genomic]). Data for transgenic arrays are the combined results from three independently-derived arrays with similar effects. Average lengths of filopodial protrusions are shown (μm). Error bars represent 2x standard error of the mean. Single asterisks (*) indicate a significant difference between wild type and the mutant (p < 0.001); Double asterisks (**) indicates a significant difference between the mutant and rescuing transgene (p < 0.001) determined by two-sided t-test with unequal variance (C-E) Fluorescence micrographs of VD growth cones in wild-type, fmo-5(tm2438), and fmo-5(tm2438); Ex[fmo-5 genomic]. Arrows indicate representative filopodia. Scale bar: 5μm.
Fig 13
Fig 13. FMO-5 activity can partially compensate for UNC-5, UNC-73/Trio, and UNC-33/CRMP.
(A,B) Quantification of VD growth cone filopodial length and growth cone area in indicated genotypes. Error bars represent 2x standard error of the mean. Asterisks indicate significant difference between wild-type and mutants (** p < 0.001) and *** indicate a significant difference between each single mutant compared to the double mutant. Pound signs (#) indicate a significant difference between [fmo-5 genomic] and double mutant (#p < 0.001) determined by two-sided t-test with unequal variance. n.s., not significant. (C-H) Fluorescence micrographs of VD growth cones from wild-type, fmo-5(tm2438), [fmo-5 genomic], unc-5; [fmo-5 genomic], unc-33; [fmo-5 genomic]and fmo-1; [fmo-5 genomic]. The arrowhead points to a growth cone with limited protrusion. Arrows indicate representative filopodia. Scale bar: 5μm.
Fig 14
Fig 14. Genetic model of inhibition of growth cone protrusion.
UNC-5 homodimers and/or UNC-5:UNC-40 heterodimers act through the Rac GTP exchange factor UNC-73/Trio and the Rac GTPases, which then utilize the flavin monooxygenases and UNC-33/CRMP to inhibit protrusion. The FMOs might inhibit protrusion directly, by possibly directly oxidizing F-actin, or by promoting phosphorylation of UNC-33/CRMP.

References

    1. Pak CW, Flynn KC, Bamburg JR. Actin-binding proteins take the reins in growth cones. Nat Rev Neurosci. 2008;9(2):136–47. doi: 10.1038/nrn2236 . - DOI - PubMed
    1. Gallo G, Letourneau PC. Regulation of growth cone actin filaments by guidance cues. J Neurobiol. 2004;58(1):92–102. doi: 10.1002/neu.10282 . - DOI - PubMed
    1. Zhou FQ, Cohan CS. How actin filaments and microtubules steer growth cones to their targets. J Neurobiol. 2004;58(1):84–91. doi: 10.1002/neu.10278 . - DOI - PubMed
    1. Omotade OF, Pollitt SL, Zheng JQ. Actin-based growth cone motility and guidance. Mol Cell Neurosci. 2017. doi: 10.1016/j.mcn.2017.03.001 . - DOI - PMC - PubMed
    1. Mortimer D, Fothergill T, Pujic Z, Richards LJ, Goodhill GJ. Growth cone chemotaxis. Trends Neurosci. 2008. doi: 10.1016/j.tins.2007.11.008 . - DOI - PubMed

MeSH terms