. 2017 Nov 28;136(22):2144-2157.
doi: 10.1161/CIRCULATIONAHA.117.028274. Epub 2017 Aug 31.

Exercise-Induced Changes in Glucose Metabolism Promote Physiological Cardiac Growth

Affiliations

Exercise-Induced Changes in Glucose Metabolism Promote Physiological Cardiac Growth

Andrew A Gibb et al. Circulation. .

Abstract

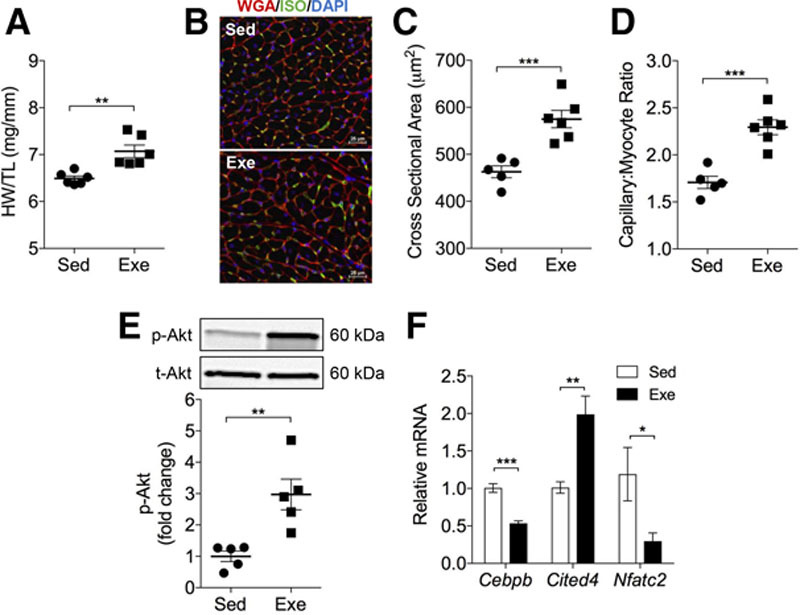
Background: Exercise promotes metabolic remodeling in the heart, which is associated with physiological cardiac growth; however, it is not known whether or how physical activity-induced changes in cardiac metabolism cause myocardial remodeling. In this study, we tested whether exercise-mediated changes in cardiomyocyte glucose metabolism are important for physiological cardiac growth.

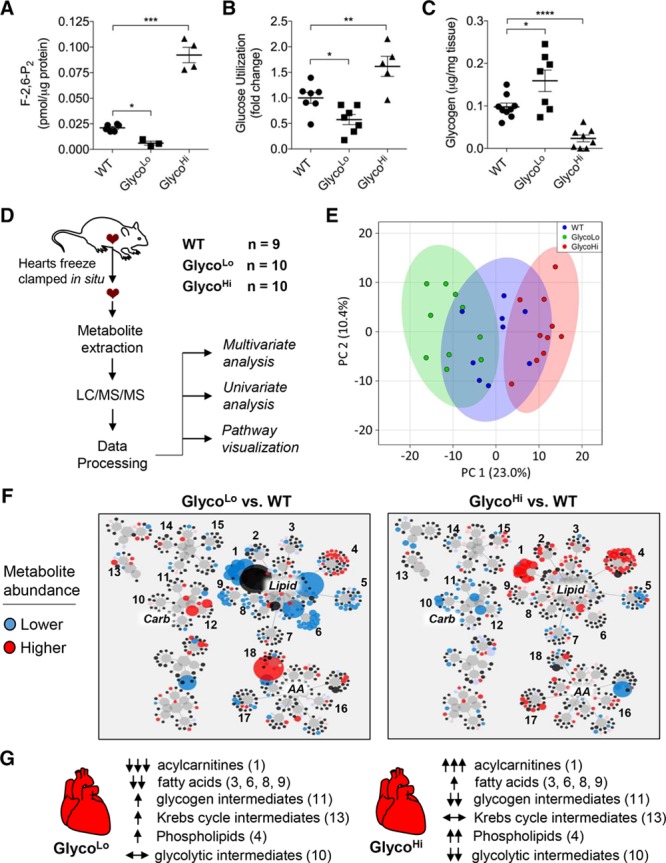
Methods: We used radiometric, immunologic, metabolomic, and biochemical assays to measure changes in myocardial glucose metabolism in mice subjected to acute and chronic treadmill exercise. To assess the relevance of changes in glycolytic activity, we determined how cardiac-specific expression of mutant forms of 6-phosphofructo-2-kinase/fructose-2,6-bisphosphatase affect cardiac structure, function, metabolism, and gene programs relevant to cardiac remodeling. Metabolomic and transcriptomic screenings were used to identify metabolic pathways and gene sets regulated by glycolytic activity in the heart.

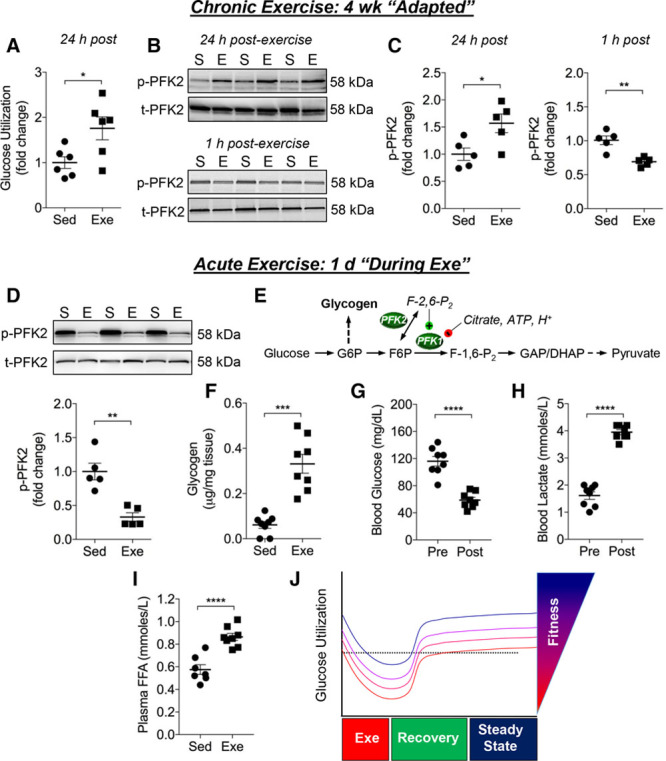
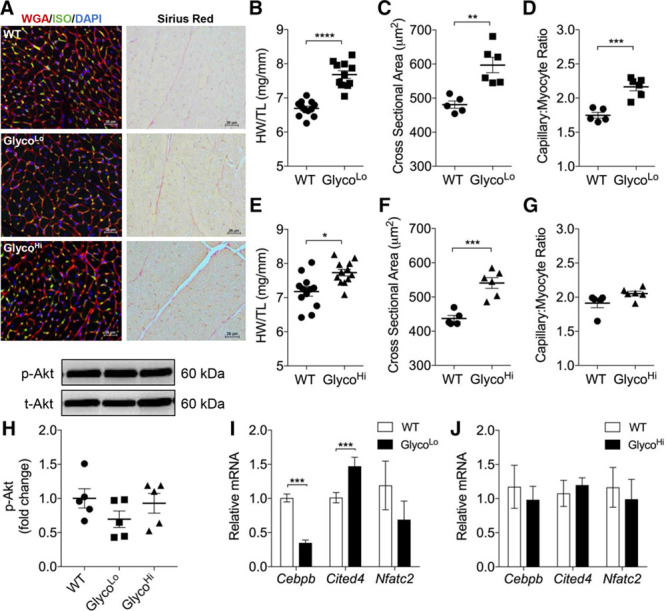
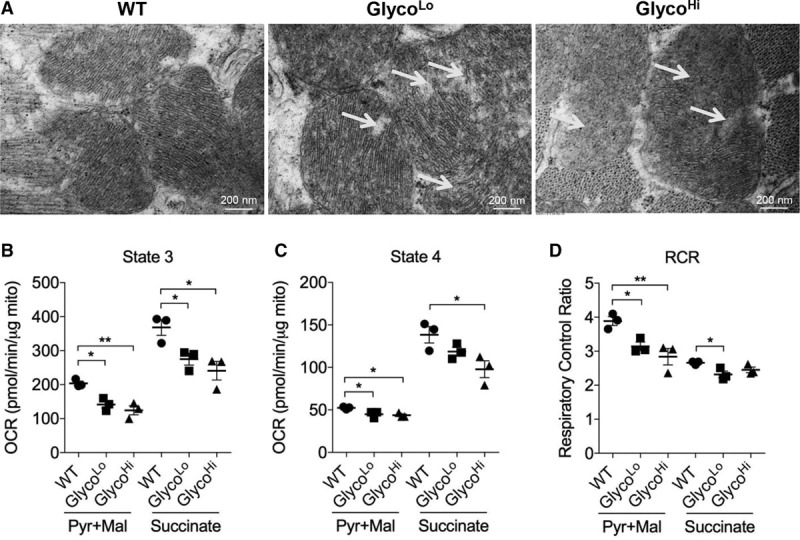
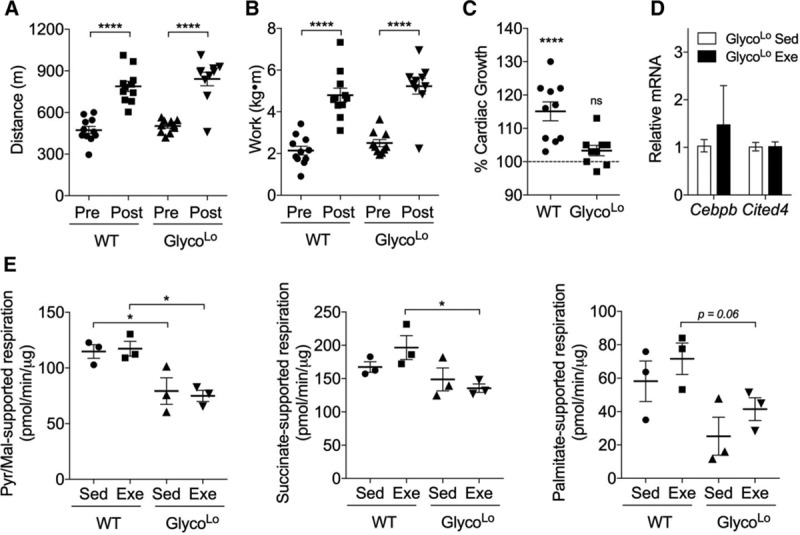
Results: Exercise acutely decreased glucose utilization via glycolysis by modulating circulating substrates and reducing phosphofructokinase activity; however, in the recovered state following exercise adaptation, there was an increase in myocardial phosphofructokinase activity and glycolysis. In mice, cardiac-specific expression of a kinase-deficient 6-phosphofructo-2-kinase/fructose-2,6-bisphosphatase transgene (GlycoLo mice) lowered glycolytic rate and regulated the expression of genes known to promote cardiac growth. Hearts of GlycoLo mice had larger myocytes, enhanced cardiac function, and higher capillary-to-myocyte ratios. Expression of phosphatase-deficient 6-phosphofructo-2-kinase/fructose-2,6-bisphosphatase in the heart (GlycoHi mice) increased glucose utilization and promoted a more pathological form of hypertrophy devoid of transcriptional activation of the physiological cardiac growth program. Modulation of phosphofructokinase activity was sufficient to regulate the glucose-fatty acid cycle in the heart; however, metabolic inflexibility caused by invariantly low or high phosphofructokinase activity caused modest mitochondrial damage. Transcriptomic analyses showed that glycolysis regulates the expression of key genes involved in cardiac metabolism and remodeling.

Conclusions: Exercise-induced decreases in glycolytic activity stimulate physiological cardiac remodeling, and metabolic flexibility is important for maintaining mitochondrial health in the heart.

Keywords: exercise; glycolysis; hypertrophy; metabolomics; mitochondria; ventricular remodeling.


Figures

Figure 1.
Figure 1.
Exercise training promotes physiological cardiac growth. Effect of treadmill training on the exercise-induced cardiac growth program. A, Gravimetric measurements of cardiac size (HW/TL, heart weight/tibia length). B, Representative myocardial sections stained with wheat germ agglutinin (red) and isolectin B4 (green). Nuclei are stained with DAPI (blue). C, Cardiomyocyte cross-sectional area. D, Capillary-to-myocyte ratio. E, Phosphorylation of AKT (Ser473) 24 hours after the last training session. F, Relative mRNA expression of Cebpb, Cited4, and Nfatc2. Data are represented as mean±SEM. *P<0.05. **P<0.01. ***P<0.001. n=5–6 per group. DAPI indicates 4′,6-diamidino-2-phenylindole; Exe, exercise; ISO, isolectin B4; Sed, sedentary; and WGA, wheat germ agglutinin.
Figure 2.
Figure 2.
Exercise dynamically regulates glucose utilization in the heart. Measurements of glucose metabolism in the heart. A, Measurement of relative myocardial glucose utilization in isolated perfused hearts from mice that remained sedentary (Sed) or that were exercised for 4 weeks (Exe). Measurements were performed on hearts excised 24 hours after the last exercise session. B, Representative immunoblots from a separate cohort of mice of S483 phosphorylation of the cardiac isoform of PFK2 (PFKFB2) in the sedentary (S) and the exercise-adapted (E) state: Upper, levels of PFK2 phosphorylation 24 hours after the last bout of exercise; Lower, PFK2 phosphorylation occurring 1 hour after the last exercise bout. C, Quantification of PFK2 phosphorylation from blots represented in B. D, Representative immunoblots of S483 phosphorylation of PFK2 in hearts of mice exercised for 1 day; these hearts were excised immediately after exercise, which would appear to be indicative of the state of PFK2 occurring during or immediately after exercise. E, Schematic representation of glycolysis showing relationship of PFK activity with glycogen storage. F, Myocardial glycogen content in hearts of Sed mice and in hearts excised immediately after 1 bout of exercise. Circulating levels of blood glucose (G), blood lactate (H), and plasma free fatty acids (FFA) (I) in mice subjected to a single bout of exercise. J, Schematic illustrating changes in glucose utilization occurring with acute and chronic exercise, ie, exercise-induced metabolic periodicity. Data are represented as mean±SEM. *P<0.05. **P<0.01. ****P<0.0001. n=5– 8 per group. DHAP indicates dihydroxyacetone phosphate; F-1,6-P2, fructose 1,6-bisphosphate; F6P, fructose 6-phosphate; G6P, glucose 6-phosphate; and GAP, glyceraldehyde-3-phosphate.
Figure 3.
Figure 3.
Cardiac F-2,6-P2 regulates myocardial glucose and lipid metabolism. Metabolic phenotyping of GlycoLo and GlycoHi mice. A, Levels of F-2,6-P2 in cardiomyocytes isolated from WT, GlycoLo, and GlycoHi mice. n=3 to 6 per group. B, Relative myocardial glucose utilization in isolated perfused hearts. n=5 to 7 per group. C, Myocardial glycogen content. n=7 to 9 per group. D, Schematic of metabolomic analysis of WT, GlycoLo, and GlycoHi hearts. E, 2D PCA analysis. F, Metabolic network visualization of metabolites in GlycoLo and GlycoHi hearts in comparison with corresponding WT hearts. Circle size is indicative of the magnitude of change (blue and red circles indicate significantly decreased or increased metabolite abundance in comparison with WT controls, respectively). Numbers represent metabolites in the following subpathways: 1, acylcarnitines; 2, monacylglycerols; 3, monohydroxy fatty acids; 4, phospholipid metabolism; 5, lysolipids; 6, polyunsaturated fatty acids; 7, sphingolipids; 8, dicarboxylic fatty acids; 9, long-chain fatty acids; 10, glycolysis; 11, fructose, mannose, galactose metabolism; 12, pentose metabolism; 13, TCA cycle; 14, purine metabolism, (hypo)xanthine/inosine; 15, purine metabolism, adenine; 16, Gly, Ser, Thr metabolism; 17, BCAA metabolism; 18, Met, Cys, SAM, Tau metabolism. G, Overview of changes in major metabolic subpathways in GlycoLo and GlycoHi hearts (F). *P<0.05. **P<0.01. ***P<0.001. ****P<0.0001 versus the indicated group. BCAA indicates branched-chain amino acid; F-2,6-P2, fructose 2,6,-bisphosphate; LC/MS/MS, liquid chromatography/tandem mass spectrometry; PCA, principal component analysis; SAM, S-adenosyl methionine; TCA, tricarboxylic acid; and WT, wild type.
Figure 4.
Figure 4.
Constitutive changes in glycolysis promote cardiac growth and hypertrophy. Structural and molecular indices of cardiac growth/hypertrophy. A, Representative myocardial sections stained for: Left, wheat germ agglutinin (red), isolectin B4 (green), and DAPI (blue); and Right, Picrosirius red. B and E, Gravimetric measurement of cardiac size (HW/TL, heart weight/tibia length). C and F, Cardiomyocyte cross-sectional area. D and G, Capillary-to-myocyte ratio. H, Basal phosphorylation of AKT (Ser473). I and J, Relative mRNA expression of genes associated with the physiological growth program. Data are represented as mean±SEM. *P<0.05. **P<0.01. ***P<0.001. ****P<0.0001. n=6 to 12 per group. DAPI indicates 4′,6-diamidino-2-phenylindole; ISO, isolectin B4; WGA, wheat germ agglutinin; and WT, wild type.
Figure 5.
Figure 5.
Metabolic inflexibility disrupts cristae structure and causes mitochondrial dysfunction. A, Electron micrographs of WT, GlycoLo, and GlycoHi hearts. Arrows indicate areas of decreased cristae organization and density in comparison with WT controls. State 3 (B) and State 4 (C) respiration in isolated cardiac mitochondria measured by using complex I (pyruvate+malate)– and complex II (succinate)–specific substrates. D, Respiratory control ratios. Data are represented as mean±SEM. *P<0.05. **P<0.01. n=3 per group. OCR indicates oxygen consumption rate; RCR, respiratory control ratio; and WT, wild type
Figure 6.
Figure 6.
Low myocardial glycolytic rates are sufficient for maximal cardiac growth. Effects of exercise training on exercise capacity, cardiac growth, and mitochondrial function in WT and GlycoLo mice. Pre- and posttraining distance (A) and work (B). C, Percent cardiac growth in exercise-adapted (Exe) mice in comparison with sedentary (Sed) controls. n=10 to 11 per group. D, Relative mRNA expression of genes associated with the physiological growth program. n=5 per group. E, State 3 respiration in isolated cardiac mitochondria using complex I (pyruvate+malate)–, complex II (succinate)–, and fatty acid oxidation (palmitoylcarnitine+malate)–specific substrates. n=3 per group. Data are represented as mean±SEM. *P<0.05. ****P<0.0001. WT indicates wild type.

Comment in

Similar articles

Cited by

References

    1. Vega RB, Konhilas JP, Kelly DP, Leinwand LA. Molecular mechanisms underlying cardiac adaptation to exercise. Cell Metab. 2017;25:1012–1026. doi: 10.1016/j.cmet.2017.04.025. - PMC - PubMed
    1. Egan B, Zierath JR. Exercise metabolism and the molecular regulation of skeletal muscle adaptation. Cell Metab. 2013;17:162–184. doi: 10.1016/j.cmet.2012.12.012. - PubMed
    1. López-Otín C, Galluzzi L, Freije JM, Madeo F, Kroemer G. Metabolic control of longevity. Cell. 2016;166:802–821. doi: 10.1016/j.cell.2016.07.031. - PubMed
    1. Bassett DR, Jr, Howley ET. Limiting factors for maximum oxygen uptake and determinants of endurance performance. Med Sci Sports Exerc. 2000;32:70–84. - PubMed
    1. Wilson MG, Ellison GM, Cable NT. Basic science behind the cardiovascular benefits of exercise. Br J Sports Med. 2016;50:93–99. doi: 10.1136/bjsports-2014-306596rep. - PubMed

MeSH terms