Randomized Controlled Trial
. 2017 Nov;66(11):2764-2773.
doi: 10.2337/db16-1478. Epub 2017 Aug 31.

Opioid Receptor Activation Impairs Hypoglycemic Counterregulation in Humans

Affiliations
Randomized Controlled Trial

Opioid Receptor Activation Impairs Hypoglycemic Counterregulation in Humans

Michelle Carey et al. Diabetes. 2017 Nov.

Abstract

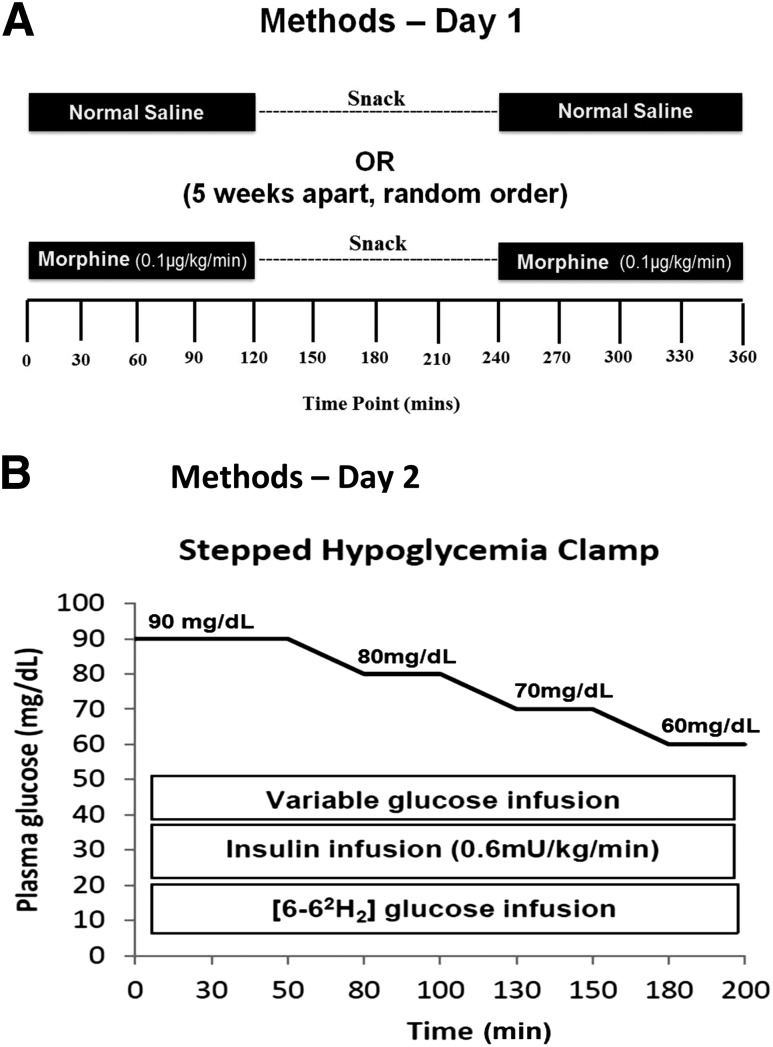
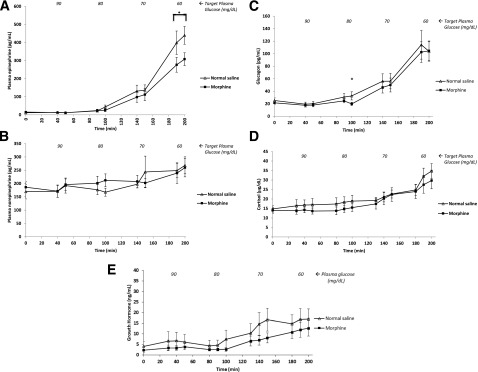
Although intensive glycemic control improves outcomes in type 1 diabetes mellitus (T1DM), iatrogenic hypoglycemia limits its attainment. Recurrent and/or antecedent hypoglycemia causes blunting of protective counterregulatory responses, known as hypoglycemia-associated autonomic failure (HAAF). To determine whether and how opioid receptor activation induces HAAF in humans, 12 healthy subjects without diabetes (7 men, age 32.3 ± 2.2 years, BMI 25.1 ± 1.0 kg/m2) participated in two study protocols in random order over two consecutive days. On day 1, subjects received two 120-min infusions of either saline or morphine (0.1 μg/kg/min), separated by a 120-min break (all euglycemic). On day 2, subjects underwent stepped hypoglycemic clamps (nadir 60 mg/dL) with evaluation of counterregulatory hormonal responses, endogenous glucose production (EGP, using 6,6-D2-glucose), and hypoglycemic symptoms. Morphine induced an ∼30% reduction in plasma epinephrine response together with reduced EGP and hypoglycemia-associated symptoms on day 2. Therefore, we report the first studies in humans demonstrating that pharmacologic opioid receptor activation induces some of the clinical and biochemical features of HAAF, thus elucidating the individual roles of various receptors involved in HAAF's development and suggesting novel pharmacologic approaches for safer intensive glycemic control in T1DM.

Trial registration: ClinicalTrials.gov NCT00678145.


Figures

Figure 1
Figure 1
Study protocol. A: On day 1, each subject received a 2-h infusion of either normal saline or morphine (to simulate a placebo or hypoglycemic event, respectively). Infusions were discontinued for a 2-h interval during which time the subjects received a snack, and then the same infusion was repeated. Each subject was randomly assigned to receive both infusions, separated by at least 5 weeks. B: On day 2, each patient underwent a stepped hypoglycemic clamp study. This was identical in all protocols. Insulin was infused at a constant rate for the entire study. Plasma glucose concentrations were clamped for 50-min intervals at each target level: 90, 80, 70, and 60 mg/dL. Symptoms of hypoglycemia were measured at each step.
Figure 2
Figure 2
Plasma glucose concentrations during the stepped hypoglycemic clamp (day 2). Target plasma glucose concentrations were achieved in both groups, with no significant differences between the studies.
Figure 3
Figure 3
Plasma insulin and C-peptide concentrations. Plasma insulin (A) and C-peptide (B) concentrations were nearly identical in both groups at each target glucose level throughout the study. Average values are shown.
Figure 4
Figure 4
Plasma counterregulatory hormone concentrations. A: Plasma epinephrine concentrations were comparable in both groups during the 90 and 80 mg/dL glucose steps. At the hypoglycemic nadir of 60 mg/dL, there was a 30.3% reduction in epinephrine levels in the morphine study group compared with control subjects (P = 0.02). Plasma norepinephrine (B) and cortisol (D) concentrations were similar in both groups without any significant differences. Plasma glucagon (C) concentrations were significantly lower in the morphine group, but only at the 80 mg/dL glucose step. Plasma growth hormone (E) concentrations trended lower in the all hypoglycemic steps of the morphine studies, particularly at the 70 mg/dL step (P = 0.097), but did not reach statistical significance. Average values are shown. *P < 0.05.
Figure 5
Figure 5
EGP and glucose infusion rates. A: EGP rates trended lower at every glucose step in the morphine studies, and these differences reached statistical significance at the 80 mg/dL glucose step (P = 0.04). B: Both groups demonstrated similar rates of glucose uptake, as quantified by Rd. C: Glucose infusion rates were similar during the 90 and 80 mg/dL glucose steps. During the 70 and 60 mg/dL glucose steps, higher glucose infusion rates were required to maintain target plasma glucose levels in the morphine studies when compared with the normal saline control subjects (P < 0.01 for both steps). *P < 0.05, **P < 0.01.
Figure 6
Figure 6
Hypoglycemia symptoms score. Using the Edinburgh Hypoglycemia Score, 11 symptoms of hypoglycemia were evaluated at each glucose step. During hypoglycemia the day after morphine infusion, subjects reported fewer symptoms of hypoglycemia, which reached statistical significance at the 60 mg/dL glucose step (P = 0.03). *P < 0.05.

References

    1. The DCCT Research Group Epidemiology of severe hypoglycemia in the diabetes control and complications trial. Am J Med 1991;90:450–459 - PubMed
    1. Group UKHS; UK Hypoglycaemia Study Group . Risk of hypoglycaemia in types 1 and 2 diabetes: effects of treatment modalities and their duration. Diabetologia 2007;50:1140–1147 - PubMed
    1. Cryer PE. The barrier of hypoglycemia in diabetes. Diabetes 2008;57:3169–3176 - PMC - PubMed
    1. Geller AI, Shehab N, Lovegrove MC, et al. . National estimates of insulin-related hypoglycemia and errors leading to emergency department visits and hospitalizations. JAMA Intern Med 2014;174:678–686 - PMC - PubMed
    1. Cryer PE. Death during intensive glycemic therapy of diabetes: mechanisms and implications. Am J Med 2011;124:993–996 - PMC - PubMed

Publication types

Associated data