. 2017 Oct 15;6(10):1502-1515.
doi: 10.1242/bio.028571.

CLASP1 regulates endothelial cell branching morphology and directed migration

Affiliations

CLASP1 regulates endothelial cell branching morphology and directed migration

Nicole M Myer et al. Biol Open. .

Abstract

Endothelial cell (EC) branching is critically dependent upon the dynamic nature of the microtubule (MT) cytoskeleton. Extracellular matrix (ECM) mechanosensing is a prominent mechanism by which cytoskeletal reorganization is achieved; yet how ECM-induced signaling is able to target cytoskeletal reorganization intracellularly to facilitate productive EC branching morphogenesis is not known. Here, we tested the hypothesis that the composition and density of the ECM drive the regulation of MT growth dynamics in ECs by targeting the MT stabilizing protein, cytoplasmic linker associated protein 1 (CLASP1). High-resolution fluorescent microscopy coupled with computational image analysis reveal that CLASP1 promotes slow MT growth on glass ECMs and promotes short-lived MT growth on high-density collagen-I and fibronectin ECMs. Within EC branches, engagement of either high-density collagen-I or high-density fibronectin ECMs results in reduced MT growth speeds, while CLASP1-dependent effects on MT dynamics promotes elevated numbers of short, branched protrusions that guide persistent and directed EC migration.

Keywords: CLASP; Endothelial cell; Extracellular matrix; Microtubule; Migration; Polarity.


Conflict of interest statement

Competing interestsThe authors declare no competing or financial interests.

Figures

Fig. 1.
Fig. 1.
CLASP1 promotes slow MT assembly. (A) Fluorescent images of an EC expressing GFP-CLASP1 (left panel) and mApple EB3 (middle panel) and merge (right panel). (B) Zoomed (4×) images from white-boxed area in respective images from A. Merged image demonstrates co-localization at the MT plus-end. (C) Western blot of whole-cell lysate of ECs. (D) Average densitometry of three individual western blots quantifying knockdown, overexpression, and endogenous CLASP1 (control). (E) Color scheme for the four subpopulations of MT growth tracks depicted in H (n cells=336; n tracks=79,469). (F,G) Bar graph depicting the mean MT growth speeds (F) and mean MT growth lifetimes (G). (H) plusTipTracker generated MT growth track overlays from 2 min time-lapse videos of mApple-EB3 (images acquired at 2 s intervals). Scale bars in A, B and H: 10 µm. D: *P<0.001; F,G: *P<0.05; ANOVA. Error bars indicate ±s.e.m.
Fig. 2.
Fig. 2.
ECM density regulates MT growth lifetimes in a CLASP1-dependent manner. (A-D) Western blot of whole-cell lysate of ECs on low- or high-density collagen-I or low- or high-density fibronectin. (E-H) Average densitometry of three individual western blots quantifying knockdown, overexpression, and endogenous CLASP1 (control). (I) Comparison of control densitometry measurements from each of the above mentioned ECMs. CLASP1 expression levels were normalized to those measured in ECS cultured on low collagen I ECMs. (J,K) Comparison of mean MT growth speeds (J) and growth lifetimes (K). Light blue bars denote low-density collagen-I (45 µg/ml) and dark blue bars denote high-density collagen-I (90 µg/ml). (L,M) Comparison of mean MT growth speeds (L) and growth lifetimes (M). Light purple bars denote low-density fibronectin (10 µg/ml) and dark purple bars denote high-density fibronectin (100 µg/ml). E-I: *P<0.001; J-M: *P<0.05; n.s., not statistically different; ANOVA. Error bars indicate ±s.e.m.
Fig. 3.
Fig. 3.
CLASP1 regulates MT growth dynamics and EC branching morphology in response to ECM composition. (A,B) Comparison of mean MT growth speeds (A) and mean MT growth lifetimes (B) on either high-density collagen-I (blue) or high-density fibronectin (purple) ECMs. (C,D) Comparison of mean EC branch number (C) and mean branch length (D). (E,F) EC branching when cultured on high-density collagen-I (E) or high-density fibronectin ECMs (F). Blue lines represent branch origin and red lines represent branch length. Measurements of Individual branch and branch length are displayed for each representative cell. Scale bars: 10 µm. A,B: *P<0.05; C,D: *P<0.001; ANOVA. Error bars indicate ±s.e.m.
Fig. 4.
Fig. 4.
CLASP1 promotes slow MT dynamics within EC branches. (A) Fluorescent images of an EC expressing GFP-CLASP1 (green, far left panel and merge) and mApple EB3 (red, far left panel and merge). Merged images demonstrate co-localization of CLASP1 with EB3-labeled, growing MT plus-ends. CLASP1 displayed a uniform distribution throughout the entire cell. (B-E) Comparison of mean MT growth speeds (B and D) and mean MT growth lifetimes (C and E) in ECs cultured on high-density collagen-I (blue bars in B and C) or high-density fibronectin (purple bars in D and E). Solid bars represent dynamics within cell branches and striped bars represent dynamics within the cell body. Statistical comparisons compare branch and body means (**black significance bars), or compare branch-to-branch means (*colored significance bars) or body-to-body means (gray significance bars). (F) Still image from a time-lapse video of a CLASP1 knockdown EC expressing mApple-EB3 (top left panel). The branch is outlined in orange and the cell body is outlined in black. Overlays of MT growth tracks from the whole cell (top right panel) and zoomed regions of branch (bottom left panel) and body (bottom right panel) regions of interest are shown. MT tracks are color coded according to their growth speeds and lifetimes. (G) Regression analysis showing the correlation between branch number (top) and branch length (bottom) to average MT growth speeds within cell branches on either high-density collagen-I (left graphs) or high-density fibronectin (right graphs). Linear trend line is shown in black along with regression linearity (R2) values. Main scale bar: 10 µm; zoomed scale bars: 2 µm. *P<0.05; **P<0.05; n.s., not significant; ANOVA. Error bars indicate ±s.e.m.
Fig. 5.
Fig. 5.
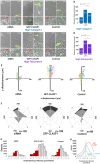
CLASP1 promotes persistent and directional EC migration. (A,C) Representative images of EC wound-edge migration on a high-density collagen-I ECM (A) or a high-fibronectin ECM (C). Red arrows represent GFP-labeled, wound-edge EC location at 0 h, and yellow arrows represent the final location of the GFP-labeled wound-edge EC at 15 h. Scale bars: 100 µm. (B,D) Mean migration distance measurements for ECs cultured on high-density collagen-I ECMs (B) or cultured on high-density fibronectin ECMs (D). (E) Migration displacement graphs of representative ECs for over a 15-h time period. (F) Rose plot diagrams of cell migration distance and direction. Quadrants 1 and 2 represent directionally positive movement into the wound edge, while quadrants 3 and 4 represent movement away from the wound edge. Black shading depicts migration events that were greater than or equal to a migratory distance of 250 µm, while gray shading depicts migratory events that were less than 250 µm. (G) Histogram showing instantaneous migration velocities binned into 0.5 µm intervals and plotted against the number of events for each interval. Bars in gray represent directionally positive movement into the wound edge. Bars in red represent movement away from the wound edge. (H) Distribution curve of instantaneous velocities for the binned intervals shown in G. *P<0.001; ANOVA. Error bars indicate ±s.e.m.

Similar articles

Cited by

References

    1. Adams J. C. and Watt F. M. (1993). Regulation of development and differentiation by the extracellular matrix. Dev. 117, 1183-1198. - PubMed
    1. Akhmanova A. and Steinmetz M. O. (2008). Tracking the ends: a dynamic protein network controls the fate of microtubule tips. Nat. Rev. Mol. Cell Biol. 9, 309-322. 10.1038/nrm2369 - DOI - PubMed
    1. Akhmanova A. and Steinmetz M. O. (2010). Microtubule +TIPs at a glance. J. Cell Sci. 123, 3415-3419. 10.1242/jcs.062414 - DOI - PubMed
    1. Akhmanova A., Hoogenraad C. C., Drabek K., Stepanova T., Dortland B., Verkerk T., Vermeulen W., Burgering B. M., De Zeeuw C. I., Grosveld F. et al. (2001). CLASPs are CLIP-115 and -170 associating proteins involved in the regional regulation of microtubule dynamics in motile fibroblasts. Cell 104, 923-935. 10.1016/S0092-8674(01)00288-4 - DOI - PubMed
    1. Al-Bassam J., Kim H., Brouhard G., van Oijen A., Harrison S. C. and Chang F. (2010). CLASP promotes microtubule rescue by recruiting tubulin dimers to the microtubule. Dev. Cell 19, 245-258. 10.1016/j.devcel.2010.07.016 - DOI - PMC - PubMed