. 2018 Oct;67(10):1769-1779.
doi: 10.1136/gutjnl-2017-314607. Epub 2017 Aug 31.

Identification of distinct mutational patterns and new driver genes in oesophageal squamous cell carcinomas and adenocarcinomas

Affiliations

Identification of distinct mutational patterns and new driver genes in oesophageal squamous cell carcinomas and adenocarcinomas

De-Chen Lin et al. Gut. 2018 Oct.

Abstract

Objectives: Oesophageal squamous cell carcinoma (OSCC) and adenocarcinoma (OAC) are distinct cancers in terms of a number of clinical and epidemiological characteristics, complicating the design of clinical trials and biomarker developments. We analysed 1048 oesophageal tumour-germline pairs from both subtypes, to characterise their genomic features, and biological and clinical significance.

Design: Previously exome-sequenced samples were re-analysed to identify significantly mutated genes (SMGs) and mutational signatures. The biological functions of novel SMGs were investigated using cell line and xenograft models. We further performed whole-genome bisulfite sequencing and chromatin immunoprecipitation (ChIP)-seq to characterise epigenetic alterations.

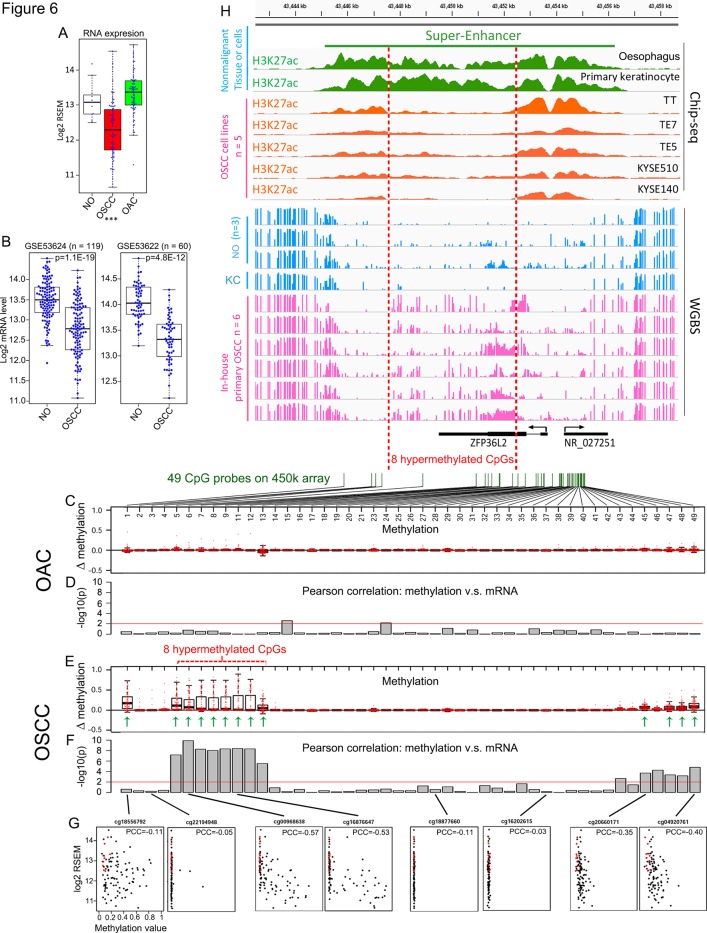
Results: OSCC and OAC displayed nearly mutually exclusive sets of driver genes, indicating that they follow independent developmental paths. The combined sample size allowed the statistical identification of a number of novel subtype-specific SMGs, mutational signatures and prognostic biomarkers. Particularly, we identified a novel mutational signature similar to Catalogue Of Somatic Mutations In Cancer (COSMIC)signature 16, which has prognostic value in OSCC. Two newly discovered SMGs, CUL3 and ZFP36L2, were validated as important tumour-suppressors specific to the OSCC subtype. We further identified their additional loss-of-function mechanisms. CUL3 was homozygously deleted specifically in OSCC and other squamous cell cancers (SCCs). Notably, ZFP36L2 is associated with super-enhancer in healthy oesophageal mucosa; DNA hypermethylation in its super-enhancer reduced active histone markers in squamous cancer cells, suggesting an epigenetic inactivation of a super-enhancer-associated SCC suppressor.

Conclusions: These data comprehensively contrast differences between OSCC and OAC at both genomic and epigenomic levels, and reveal novel molecular features for further delineating the pathophysiological mechanisms and treatment strategies for these cancers.

Keywords: gene mutation; methylation; oesophageal cancer.


Conflict of interest statement

Competing interests: None declared.

Figures

Figure 1
Figure 1
SMGs in OSCC, OAC and other cancer types. SMGs identified by MutSig2CV are shown on the basis of their q values and mutational fractions. Comparisons were made between OSCC against OAC (A), OAC against pan-cancer (B), OSCC against pan-cancer (C). In (A), the red circle denotes the fraction in OSCC, and the blue circle denotes OAC. q values in 20 other tumour types were retrieved from the TCGA pan-cancer study. (D) CCF analysis of SMGs. Only SMGs with at least three mutations in both cancer types are shown. p Values were derived by Fisher’s exact tests. *, p<0.05; (E) The fraction of clonal and subclonal mutations in both SMGs and non-SMGs. CCF, cancer cell fraction; OAC, oesophageal adenocarcinoma; OSCC, oesophageal squamous cell carcinoma; SMG, significantly mutated gene; TCGA, The Cancer Genome Atlas.
Figure 2
Figure 2
De novo mutational signature analysis of both types of oesophageal cancers. (Left panel) 96 trinucleotide substitutions of 6 mutational signatures identified by the NMF method in oesophageal cancers. (Right panel) Heatmap showing unsupervised hierarchical clustering of both OSCC and OAC tumours based on the weight of each signature in each sample. Black, OSCC; white, OAC. Pie chart showing the fraction of samples from either subtypes having the indicated signature. OAC, oesophageal adenocarcinoma; OSCC, oesophageal squamous cell carcinoma; NMF, negative matrix factorisation.
Figure 3
Figure 3
Survival-associated mutational signatures and SMGs. (A) Kaplan Meier survival analysis was performed for both OSCC and OAC; p value was determined using log-rank test. (B) Cox regression analyses was performed to identify independent prognostic factors. See also online supplementary figure 6. OAC, oesophageal adenocarcinoma; OSCC, oesophageal squamous cell carcinoma; SMGs, significantly mutated genes.
Figure 4
Figure 4
Tumour-suppressive property of CUL3 and ZFP36L2 in oesophageal squamous cell carcinoma (OSCC) cells. CUL3 and ZFP36L2 expression were depleted via siRNAs in TE7 (A), KYSE510 (B) and KYSE150 (C) cell lines and subjected to colony formation and cell migration assay. (D,E) TE7 and KYSE510 cells ectopically expressing either CUL3 (D) or ZFP36L2 (E) were subjected to western blotting (upper left), colony formation (lower left), as well as cell migration assays (right). Data represent mean±SD. Values were determined using t-test; *, p<0.05; **, p<0.01; ***, p<0.001. (F) TE7 cells ectopically expressing either CUL3 or ZFP36L2 were grown as xenograft; tumour volumes and weight are shown. Horizontal bar denotes mean value.
Figure 5
Figure 5
Genomic abnormalities of CUL3 enhance both NRF2 and wingless in Drosophila (WNT)/β-catenin pathways. (A) Integrative Genomics Viewer (IGV) snapshot of CUL3 homozygous deletions in TCGA pan-SCC samples. Relative copy number value was denoted by the colour bar. (B) Frequency of homozygous deletions and somatic mutations in CUL3 across cancer types. Squamous lineage tumours are highlighted in pink squares. BLCA is also highlighted as a significant proportion of them are molecularly squamous-like. Insert panel showing the distribution of CUL3 somatic mutations in both OSCC and pan-SCC (including LUSC, HNSC and cervical squamous cell carcinoma (CESC), summarised from TCGA results). Black and purple dots, truncating mutations; green dots, missense mutations. pRCC, papillary renal cell carcinoma; LUAD, lung adenocarcinoma; ccRCC, clear cell renal cell carcinoma; ACC, adenoid cystic carcinoma; BRCA, breast invasive carcinoma; HCC, hepatocellular carcinoma; chRCC, chromophobe renal cell carcinoma; DLBC, diffuse large B cell lymphoma; GBM, glioblastoma multiforme; PCPG, pheochromocytoma and paraganglioma. (C) mRNA levels of CUL3 in TCGA pan-SCC cohorts. Samples are grouped based on their gene dosage. Hem Loss, heterozygous deletion; Hom Del, homozygous deletion. (D) CUL3 was either silenced by siRNA (left) or ectopically expressed (right) in OSCC cells, followed by western blotting analysis or (E) qRT-PCR assay. Scr, scramble siRNA; EV, empty vector. p Values were determined using t-test; ***, p<0.001. (F) Comparison of β-catenin or NRF2 protein levels between CUL3 intact (wildtype (WT)) against mutant or deleted (altered (ALT)) TCGA SCC samples. (G) Colony formation assay demonstrating the synergistic effect of ICG001 and Trig. (H) A model of CUL3 genomic inactivation in SCC cells and its implication. BLCA, bladder cancer; LUSC, squamous cell cancer of the lung; HNSC, squamous cell cancer of the head and neck; OSCC, oesophageal squamous cell carcinoma; SCC, squamous cell carcinoma; STAD, stomach adenocarcinoma; TCGA, The Cancer Genome Atlas;
Figure 6
Figure 6
Enhancer hypermethylation and reduced expression of ZFP36L2 in OSCC. (A) ZFP36L2 mRNA level in TCGA non-malignant oesophagus (NO), OSCC and OAC samples. ***, p<0.001 comparing OSCC to NO (t-test). (B) ZFP36L2 mRNA level was retrieved from two different RNA array results comparing matched OSCC samples and their adjacent NO. (C and E) Box plots showing the increase of methylation values (tumour-normal) in either OAC or OSCC samples relative to NO tissues across 47 out of 49 CpG probes (two had no values) in ZFP36L2 loci and flanking regions. (D and F) Column plots showing the significance of Pearson correlation test between the methylation value of each CpG and ZFP36L2 mRNA level in either OAC or OSCC samples. Red lines in (D) and (F) denote significant level (p=0.01). (G) Scatter plots showing Pearson correlation of representative CpGs. Red dots denote NO samples, black dots denote tumour samples. (H) IGV snapshot displaying hypermethylation of ZFP36L2 enhancer in OSCC samples (pink tracks) compared with NO epithelium or primary keratinocytes (KC, blue tracks) measured by WGBS assay. Associated histone modifications in NO and primary keratinocytes (green tracks) and OSCC cell lines (orange tracks) are shown, and a super-enhancer region is highlighted. All the ChIP-seq tracks are in the same scale (0–8) and so are the WGBS tracks (0–1). OAC, oesophageal adenocarcinoma; OSCC, oesophageal squamous cell carcinoma; TCGA, The Cancer Genome Atlas. PCC, pearson correlation coefficient; WGBS, whole-genome bisulfite sequencing.
Figure 7
Figure 7
Lineage-specific ZFP36L2 epigenetic silencing in squamous cell carcinoma (SCC) samples. (A) Box plots showing the increase of methylation value (tumour-normal) in indicated cancers relative to their matched non-malignant tissues across the same set of CpG probes as in figure 6C. Column plots showing the significance of Pearson correlation test between the methylation value of each CpG and ZFP36L2 mRNA level in indicated cancer types. Red line denotes p=0.01. (B) Bar plots comparing ZFP36L2 mRNA expression between matched non-malignant tissues (N) and tumour samples (T) in indicated cancer types. LUSC, squamous cell cancer of the lung; HNSC, squamous cell cancer of the head and neck; STAD, stomach adenocarcinoma.

References

    1. Siegel RL, Miller KD, Jemal A. Cancer statistics, 2016. CA Cancer J Clin 2016;66:7–30. 10.3322/caac.21332 - DOI - PubMed
    1. Brown LM, Devesa SS, Chow WH. Incidence of adenocarcinoma of the esophagus among white Americans by sex, stage, and age. J Natl Cancer Inst 2008;100:1184–7. 10.1093/jnci/djn211 - DOI - PMC - PubMed
    1. Hao JJ, Lin DC, Dinh HQ, et al. Spatial intratumoral heterogeneity and temporal clonal evolution in esophageal squamous cell carcinoma. Nat Genet 2016;48:1500–7. 10.1038/ng.3683 - DOI - PMC - PubMed
    1. Stachler MD, Taylor-Weiner A, Peng S, et al. Paired exome analysis of Barrett’s esophagus and adenocarcinoma. Nat Genet 2015;47:1047–55. 10.1038/ng.3343 - DOI - PMC - PubMed
    1. Ross-Innes CS, Becq J, Warren A, et al. Whole-genome sequencing provides new insights into the clonal architecture of Barrett’s esophagus and esophageal adenocarcinoma. Nat Genet 2015;47:1038–46. 10.1038/ng.3357 - DOI - PMC - PubMed

Publication types

LinkOut - more resources