. 2017 Aug 31;7(1):10117.
doi: 10.1038/s41598-017-10371-5.

Radiomics strategies for risk assessment of tumour failure in head-and-neck cancer

Affiliations

Radiomics strategies for risk assessment of tumour failure in head-and-neck cancer

Martin Vallières et al. Sci Rep. .

Abstract

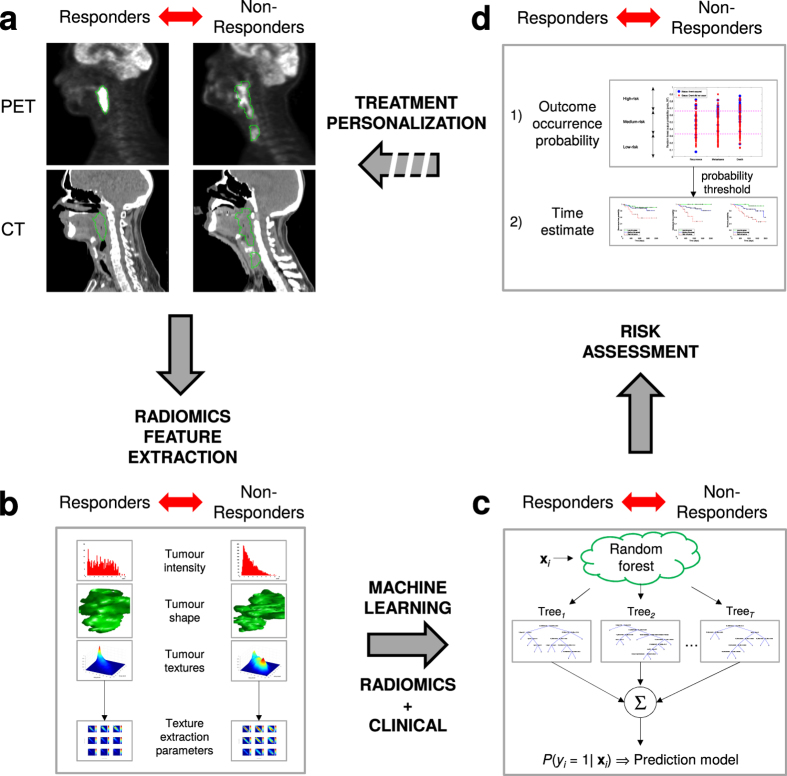
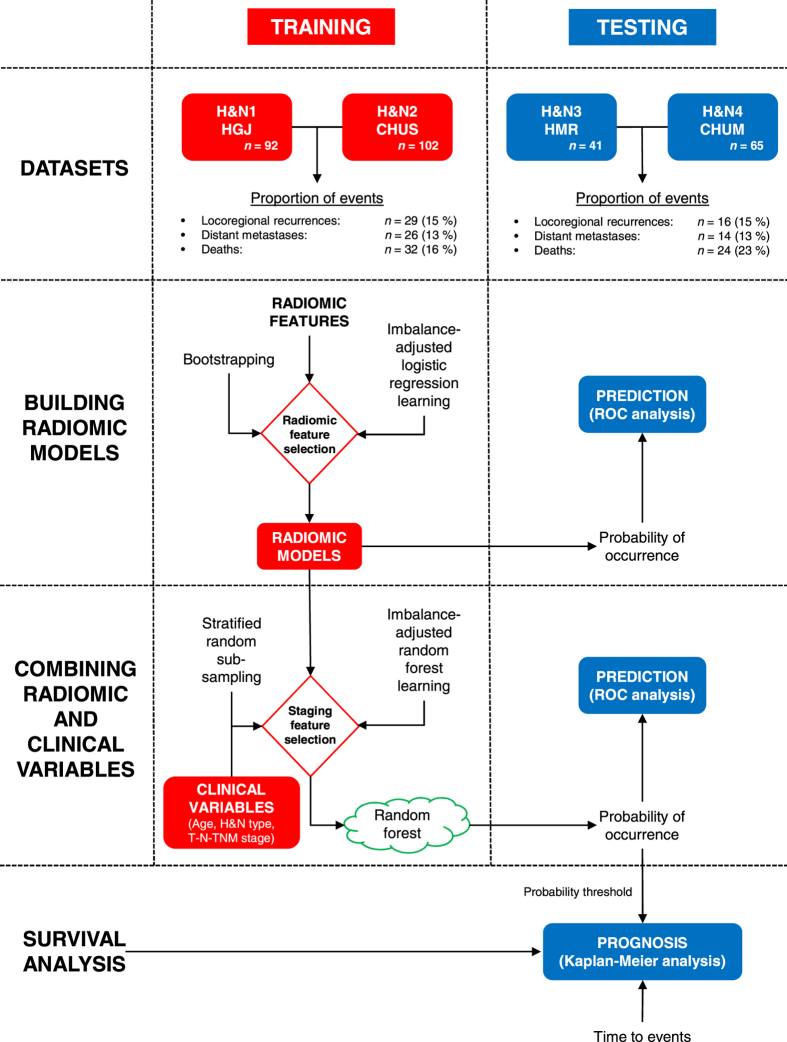
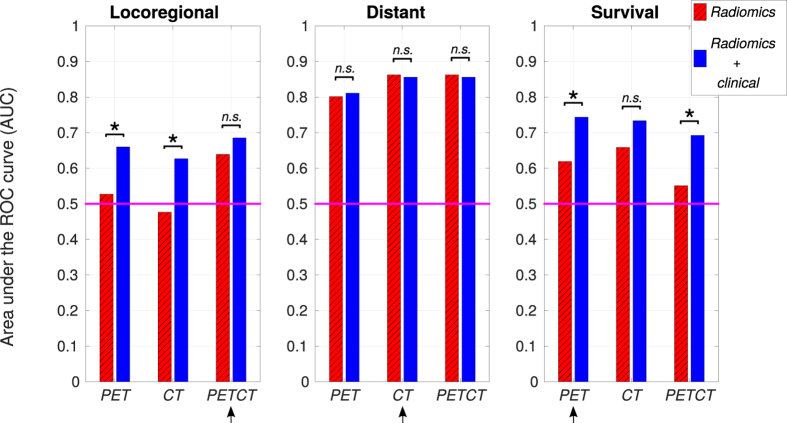
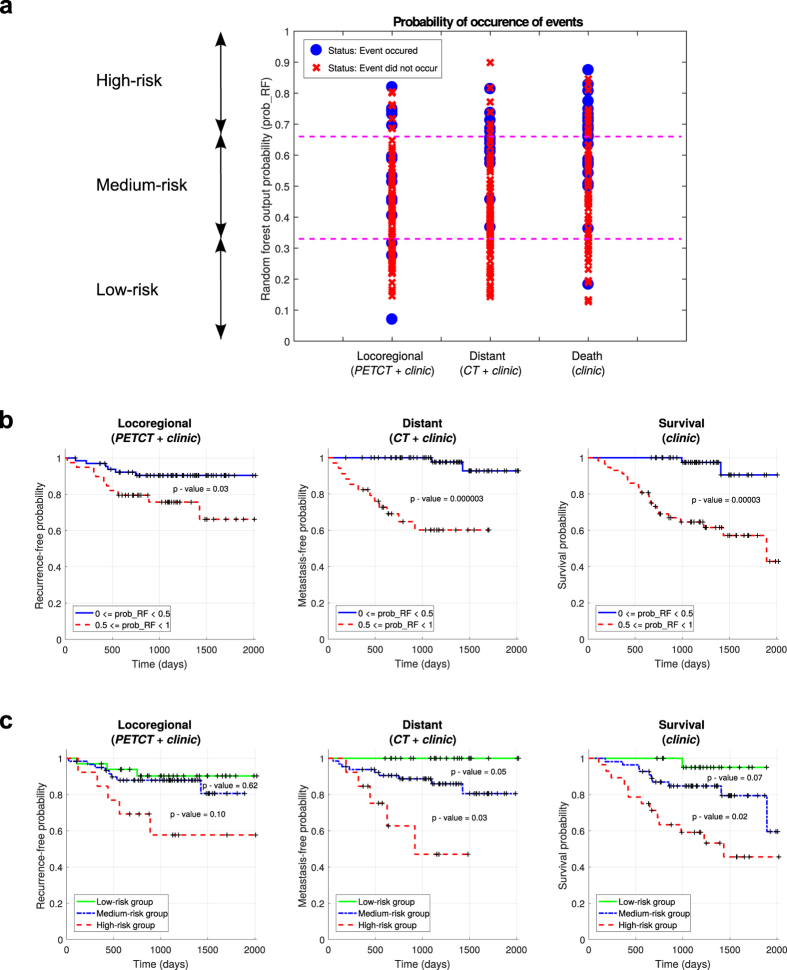
Quantitative extraction of high-dimensional mineable data from medical images is a process known as radiomics. Radiomics is foreseen as an essential prognostic tool for cancer risk assessment and the quantification of intratumoural heterogeneity. In this work, 1615 radiomic features (quantifying tumour image intensity, shape, texture) extracted from pre-treatment FDG-PET and CT images of 300 patients from four different cohorts were analyzed for the risk assessment of locoregional recurrences (LR) and distant metastases (DM) in head-and-neck cancer. Prediction models combining radiomic and clinical variables were constructed via random forests and imbalance-adjustment strategies using two of the four cohorts. Independent validation of the prediction and prognostic performance of the models was carried out on the other two cohorts (LR: AUC = 0.69 and CI = 0.67; DM: AUC = 0.86 and CI = 0.88). Furthermore, the results obtained via Kaplan-Meier analysis demonstrated the potential of radiomics for assessing the risk of specific tumour outcomes using multiple stratification groups. This could have important clinical impact, notably by allowing for a better personalization of chemo-radiation treatments for head-and-neck cancer patients from different risk groups.


Conflict of interest statement

The authors declare that they have no competing interests.

Figures

Figure 1
Figure 1
From radiomics analysis to treatment personalization. (a) Example of diagnostic FDG-PET and CT images of two head-and-neck cancer patients with tumour contours. The patient that did not respond well to treatment (right) has a more heterogeneous intratumoural intensity distribution in both FDG-PET and CT images than the patient that responded well to treatment (left). (b) The radiomics analysis strategy involves the extraction of features differentiating responders from non-responders to treatment. Features are extracted from the FDG-PET and CT tumour contours and quantify tumour shape, intensity, and texture. (c) Advanced machine learning combines radiomic features and patient clinical information via a random forest algorithm. The classifier is trained to differentiate between responders and non-responders to treatment (prediction model). (d) The output probability of the random forest classifier computed on new patients can be used to assess the risk of non-response to treatment via probabilities of occurrence of outcome events and time estimates. Eventually, accurate risk assessment of specific tumour outcomes via radiomics analysis could help to better personalize cancer treatments.
Figure 2
Figure 2
Models construction strategy and analysis workflow. Four different cohorts were used to demonstrate the utility of radiomics analysis for the pre-treatment assessment of the risk of locoregional recurrence and distant metastases in head-and-neck cancer. The H&N1 and H&N2 cohorts were combined and used as a single training set (n = 194), whereas the H&N3 and H&N4 cohorts were combined and used as a single testing set (n = 106). The best combinations of radiomic features were selected in the training set using imbalance-adjusted logistic regression learning and bootstrapping validations. These radiomic features were combined with selected clinical variables in the training set using imbalance-adjusted random forest learning and stratified random sub-sampling validations. Independent prediction analysis was performed in the testing set for all classifiers fully constructed in the training set. Independent prognosis analysis and Kaplan-Meier risk stratification was carried out in the testing set using the output probability of occurrence of events of random forests fully constructed in the training set.
Figure 3
Figure 3
Prediction performance of selected models. All prediction models were selected and built using the training set (H&N1 and H&N2; n = 194) for three initial radiomic feature sets: I) PET radiomic features (PET); II) CT radiomic features (CT); and III) PET and CT radiomic features (PETCT). The prediction performance is evaluated here in terms of the area under the receiver operating characteristic curve (AUC) for patients of the testing set (H&N3 and H&N4; n = 106), for two types of prediction models: I) Radiomic models constructed using logistic regression (Radiomics); and II) Radiomic models combined with clinical variables via random forests (Radiomics + clinical). Significant increase in AUC from Radiomics to Radiomics + clinical models is identified with an asterisk (*), and non-significant increase is identified by n.s. The radiomic feature sets providing the prediction models with highest performance in this study are identified with an arrow for each outcome.
Figure 4
Figure 4
Risk assessment of tumour outcomes. (a) Probability of occurrence of events (locoregional recurrence, distant metastases, death) for each patient of the testing set (H&N3 and H&N4; n = 106) as determined by the random forest classifiers built using the training set (H&N1 and H&N2; n = 194). The output probability of occurrence of events of random forests allows for risk stratification; for example, three risk groups can be defined (low, medium, high) using probability thresholds of 13 and 23. (b) Kaplan-Meier curves of the testing set using a risk stratification into two groups as defined by a random forest output probability threshold of 0.5. All curves have significant prognostic performance, thus demonstrating the possibility of outcome-specific risk assessment in head-and-neck cancer. (c) Kaplan-Meier curves of the testing set using a risk stratification into three groups as defined by random forest output probability thresholds of 13 and 23. Some pair of curves have significant prognostic performance, thus demonstrating the possibility of risk stratification into multiple groups for treatment escalation/personalization in head-and-neck cancer.

References

    1. Meric-Bernstam F, Farhangfar C, Mendelsohn J, Mills GB. Building a personalized medicine infrastructure at a major cancer center. J. Clin. Oncol. 2013;31:1849–1857. doi: 10.1200/JCO.2012.45.3043. - DOI - PMC - PubMed
    1. Renfro LA, An M-W, Mandrekar SJ. Precision oncology: a newera of cancer clinical trials. Cancer Lett. 2016;387:121–126. doi: 10.1016/j.canlet.2016.03.015. - DOI - PMC - PubMed
    1. Lambin P, et al. Rapid Learning health care in oncology – an approach towards decision support systems enabling customised radiotherapy. Ra-diother. Oncol. 2013;109:159–164. - PubMed
    1. Shrager J, Tenenbaum JM. Rapid learning for precision oncology. Nat. Rev. Clin. Oncol. 2014;11:109–118. doi: 10.1038/nrclinonc.2013.244. - DOI - PubMed
    1. Weitzel JN, Blazer KR, MacDonald DJ, Culver JO, Offit K. Genetics, genomics, and cancer risk assessment. CA Cancer J. Clin. 2011;61:327–359. - PMC - PubMed

Publication types

MeSH terms