. 2017 Aug 31;7(1):10179.
doi: 10.1038/s41598-017-10889-8.

Fatigue-Assisted Grain Growth in Al Alloys

Affiliations

Fatigue-Assisted Grain Growth in Al Alloys

R Goswami et al. Sci Rep. .

Abstract

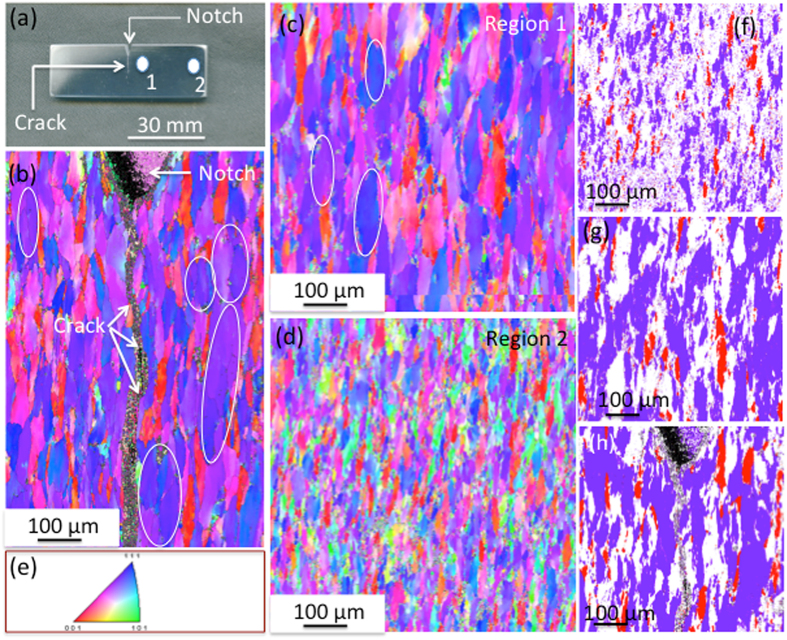
Stress-assisted grain growth at room temperature is known for materials with nanocrystalline grains. For larger grain sizes, the grain growth usually takes place at higher homologous temperatures even under stress. Here we report, for the first time, significant grain growth at room temperature under fatigue loading in microcrystalline grains (≥10 μm) in Al 7075. We demonstrate that this grain growth at room temperature is similar to non-uniform grain growth due to grain rotation and coalescence rather than the thermally and the stress-assisted driven grain growth. We show that the grain growth is associated with the formation of a strong near-Cu {112}<111> texture component as a result of fatigue-assisted deformation. These changes in microstructural features (viz., grain size, grain orientations and texture) are fundamentally important in understanding the cyclic crack induced deformation behavior and for predicting the fatigue lifetime in structural materials.


Conflict of interest statement

The authors declare that they have no competing interests.

Figures

Figure 1
Figure 1
EBSD maps showing grain growth. (a) A part of the compact tension (CT) specimen showing the crack from the notch corresponding to ΔK = 13 MPa m1/2. (b) An inverse pole figure image showing the pancake sized grains at either side of the crack. (c) An inverse pole figure image showing the pancake sized grains at 5 mm from the crack. The grain size and morphology look similar to the size and morphology close to the crack. (d) An inverse pole figure image showing the pancake sized grains at 25 mm from the crack. A significant change in grain size could be observed. (e) The inverse pole figure showing the color coding. (f-h) The crystal direction maps (obtained with the <112> and <001> orientation at 10° tolerance), close to the crack, 5 mm and 25 mm away from the crack, respectively, showing grain coalescence in number of regions within 5 mm from crack, compered to the 25 mm away from the crack.
Figure 2
Figure 2
IPF showing the size and orientation of the initial specimen before fatigue. (a) The IPF of the initial specimen in T7 condition before fatigue. (b) The size distribution before and after fatigue, showing the grain growth.
Figure 3
Figure 3
The ODF sections parallel to φ2 from 0–90° with an increment of 5° showing texture formation and grain rotation. (a) ODF sections 25 mm away from crack and (b) ODF sections 5 mm away from crack. (c) ODF sections close to the crack. A strong near {112} <111> Cu texture component, corresponding to φ1, φ, φ2 of 80°, 35° and 45°, respectively, develops within 5 mm from crack. The φ2 = 45° sections for all positions have been indicated by circles. (d) A schematic diagram showing the Euler coordinates, φ1, φ, φ2, for ideal cube, goss, brass, S and copper texture in FCC materials. Inset shows the intensity level, and φ1 and φ directions for Fig. 3(a–c).
Figure 4
Figure 4
The pole figures showing grain orientation close to [001] and [112] poles. (a) The poles close to the crack (b) the poles 5 mm away from crack and (c) the poles 25 mm away from crack. (d) A series of XRD diffraction patterns at different locations, close to the crack, 5 mm and 25 mm away from the crack, showing the relative variation of 111 002 and 220 peaks.
Figure 5
Figure 5
Diagrams showing mechanical behavior, and mechanism of grain coalescence and grain growth. (a) Vickers hardness as a function of distance from the crack showing the hardness decreases as we approach the crack. A band with dotted lines is drawn to show the increase in hardness with distance. (b) An IPF image, showing the coalescence of at least 10 grains close to a <112> orientation. (c) A color triangle showings grain orientations that are 10–19° apart from <112> orientation can be rotated into <112> with 10° tolerance by 9° rotation. (d) Schematic diagrams showing that three grains with high-angle grain boundaries become a single grain containing low-angle grain boundaries through lattice rotation and coalescence.

References

    1. Hillert M. On the theory of normal and abnormal grain growth. Acta Metall. 1965;13:227–238. doi: 10.1016/0001-6160(65)90200-2. - DOI
    1. Louat NP. On the theory of normal grain growth. Acta Metall. 1974;22:721–724. doi: 10.1016/0001-6160(74)90081-9. - DOI
    1. Mullins WW. The statistical self-similarity hypothesis in grain growth and particle coarsening. J. Appl. Phys. 1986;59:1341–1349. doi: 10.1063/1.336528. - DOI
    1. Jones AR, Ralph B, Hansen N. Subgrain coalescence and the nucleation of recrystallization at grain boundaries in aluminium. Proc. R. Soc. Lond. A. 1979;368:345–357. doi: 10.1098/rspa.1979.0134. - DOI
    1. Saetre TO. Towards three-dimensional modeling of subgrain coalescence. Textures and Microstructures. 1996;26-27:469–478. doi: 10.1155/TSM.26-27.469. - DOI

Publication types

LinkOut - more resources