. 2017 Aug 16:8:976.
doi: 10.3389/fimmu.2017.00976. eCollection 2017.

Autoantibody Repertoire in APECED Patients Targets Two Distinct Subgroups of Proteins

Affiliations

Autoantibody Repertoire in APECED Patients Targets Two Distinct Subgroups of Proteins

Dmytro Fishman et al. Front Immunol. .

Abstract

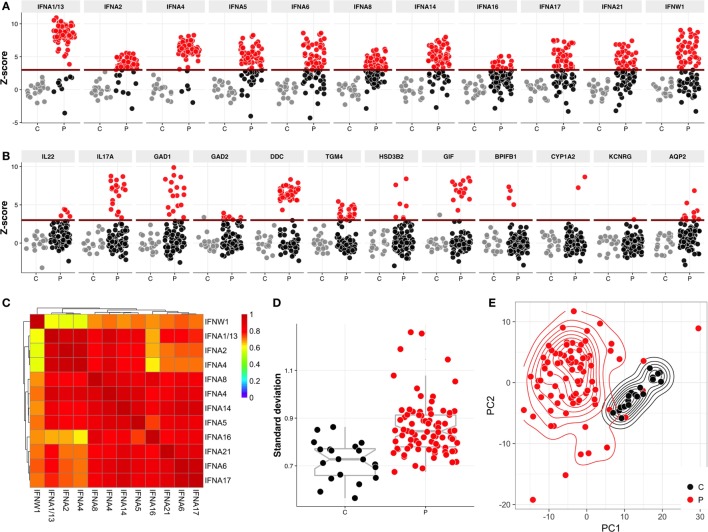
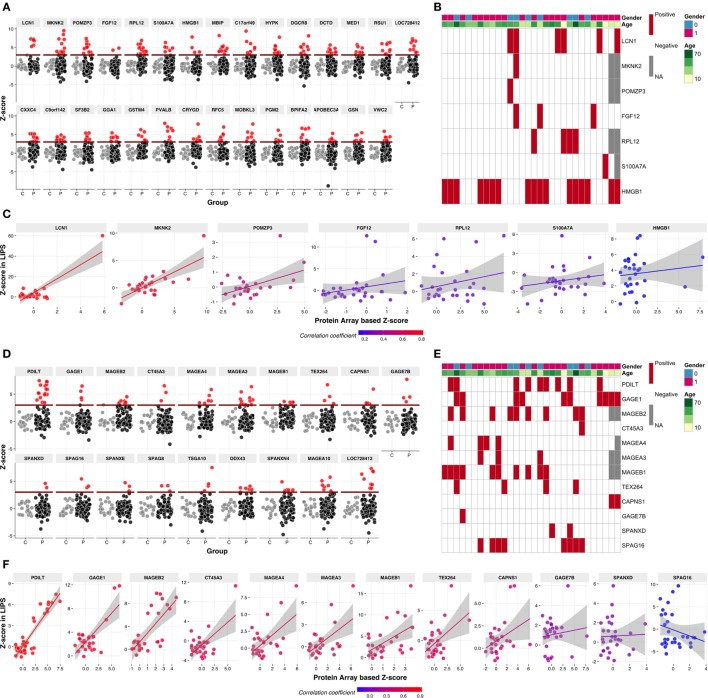
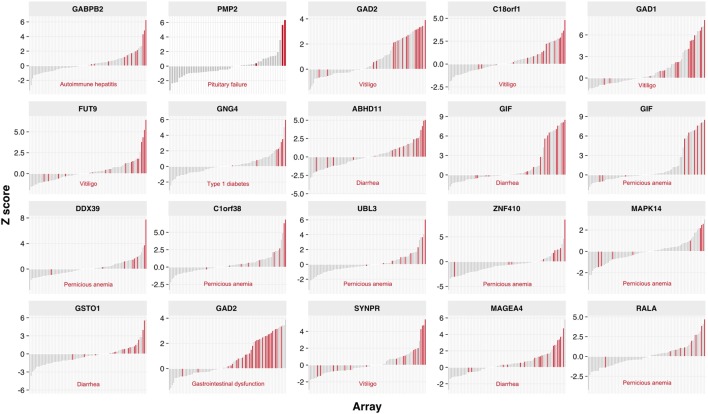
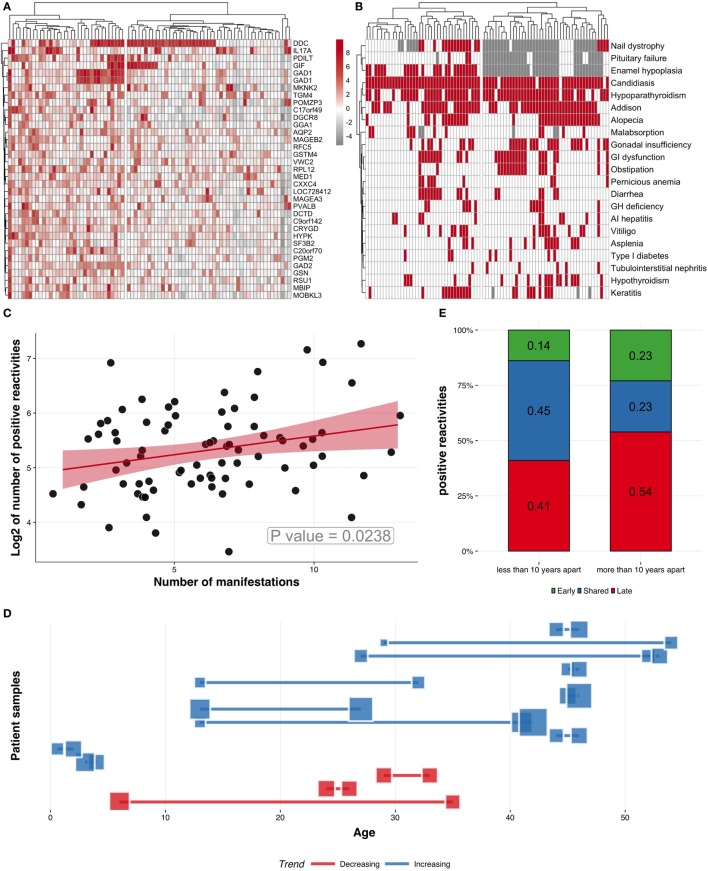
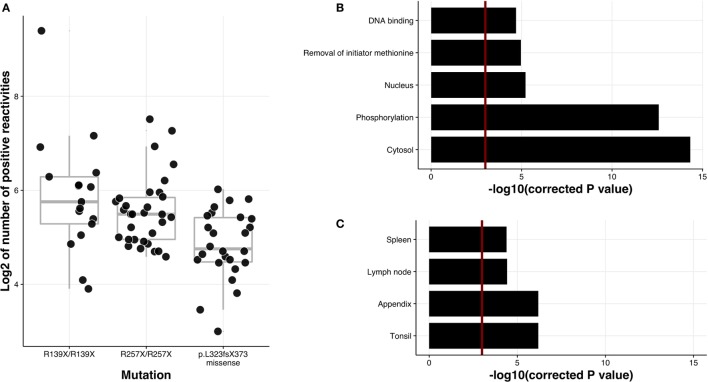
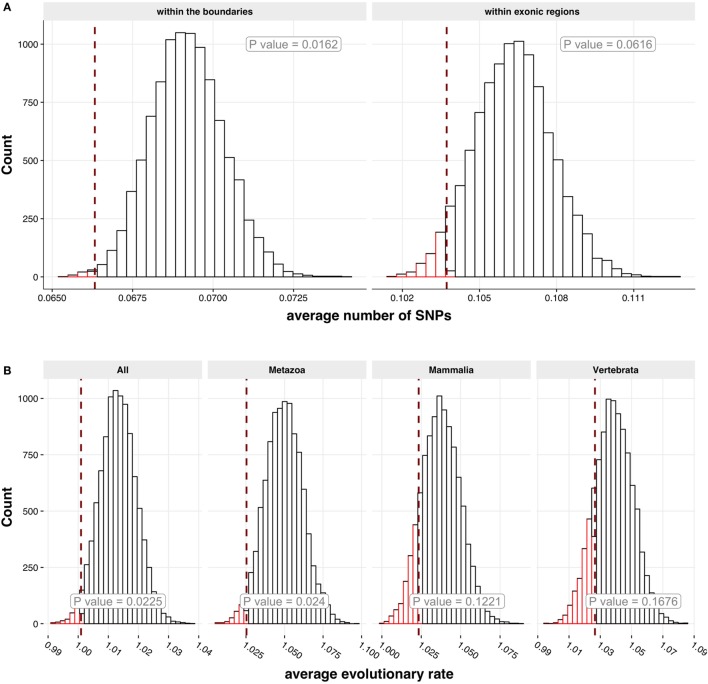
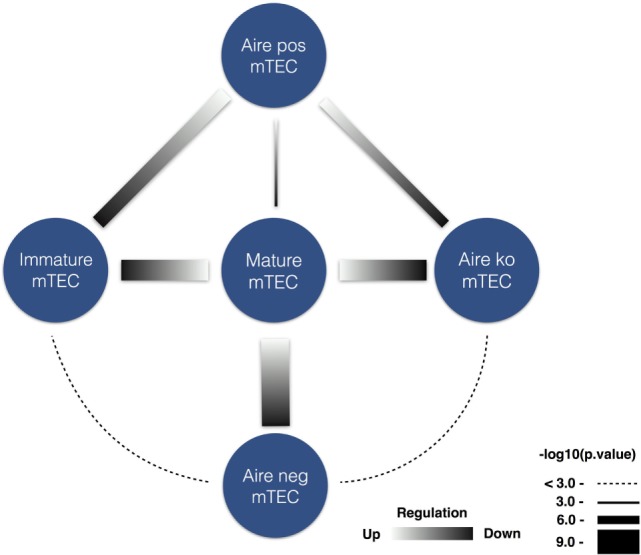
High titer autoantibodies produced by B lymphocytes are clinically important features of many common autoimmune diseases. APECED patients with deficient autoimmune regulator (AIRE) gene collectively display a broad repertoire of high titer autoantibodies, including some which are pathognomonic for major autoimmune diseases. AIRE deficiency severely reduces thymic expression of gene-products ordinarily restricted to discrete peripheral tissues, and developing T cells reactive to those gene-products are not inactivated during their development. However, the extent of the autoantibody repertoire in APECED and its relation to thymic expression of self-antigens are unclear. We here undertook a broad protein array approach to assess autoantibody repertoire in APECED patients. Our results show that in addition to shared autoantigen reactivities, APECED patients display high inter-individual variation in their autoantigen profiles, which collectively are enriched in evolutionarily conserved, cytosolic and nuclear phosphoproteins. The APECED autoantigens have two major origins; proteins expressed in thymic medullary epithelial cells and proteins expressed in lymphoid cells. These findings support the hypothesis that specific protein properties strongly contribute to the etiology of B cell autoimmunity.

Keywords: autoantibodies; autoantigen; autoimmune regulator; immune tolerance; thymus.


Figures

Figure 1
Figure 1
Protoarray reactivities to type I interferons (IFNs) and to known autoantigens. The reactivities to (A) type I IFNs and (B) known APECED autoantigens. The Protoarray signals are expressed as z-scores representing the number of SDs from the mean of combined control samples. Positive-negative discrimination level (dark red line) was set at z = 3. Red circles represent the samples with z > 3, gray circles are control samples. (C) Heatmap of correlation coefficients of type I IFN reactivities between each other. (D) Variation analysis of controls and patients—each dot on this figure represents a SD within sample over all Protoarray signals. Red circles represent patients (P) and black controls (C). Variance in patient samples are significantly higher (p = 2.598e−07) in comparison to control samples. (E) Principal component analysis plot of controls and patients. The first two principle components explain 35.8 and 11.5% of total variance, respectively. First 50 most common autoantibody reactivities were used in order to build this plot.
Figure 2
Figure 2
Autoantibody reactivities to selected novel autoantigens. (A) The Protoarray signals are expressed as z-scores representing the number of SDs from the mean of combined control samples. Positive–negative discrimination level (dark red line) was set at z = 3. Red circles represent the samples with z > 3, gray circles are control samples. (B) Seven out of the 29 novel autoantigens were tested in luciferase immunoprecipitation (LIPS) using a subset of 30 Finnish APECED patients’ samples. Red color in the cells of the heatmap represents positive reactivity (z > 3), gray cells indicate missing values and white color stands for missing autoantibodies. Rows on top indicate gender and age. (C) Correlation analysis of Protoarray and LIPS results on the autoantigens in panel (B). (D) z-Scores to 19 cancer–testis antigens (CT-As) in APECED patients according to Protoarray results coded as in panel (A). (E) Twelve of identified CT-As were retested using LIPS assay in a subset of 30 Finnish APECED patients. Color code as in panel (B). (F) Correlation analysis of Protoarray and LIPS results of CT-As in panel (E). Color of dots and fitted linear trends in panels (C,F) represent the value of correlation coefficient, higher coefficient values are encoded as red color and low or negative correlation as blue.
Figure 3
Figure 3
Autoantibody reactivities associated with APECED patients clinical and phenotypic features. Association of Protoarray z-scores with corresponding clinical manifestations. The height of the bar depicts z-score of the sample, red bars represent samples positive for a given manifestation (indicated below each plot). All other bars in gray represent autoantibody levels in patient samples without the certain clinical manifestation. Only statistically significant associations are shown (p < 0.05) and adjusted across 900 most reactive proteins on Protoarray using moderated contrast t-test.
Figure 4
Figure 4
Characteristics of APECED patients and Protoarray reactivities. (A) Clustering patients and z-scores for the 50 most commonly recognized autoantigens using hierarchical clustering algorithm. (B) Clustering patients (columns) according to their clinical manifestations (rows). Red squares represent the presence of a given manifestation, while white and gray show absence of manifestation and missing information, respectively. (C) Positive correlation between the number of manifestations and the number of autoantigens (z > 3, logarithmized), correlation coefficient ~0.29. (D) Analysis of longitudinal serum samples taken at different time points. Blue squares and connecting lines (n = 11) correspond to samples with increased number of autoantigens and red squares and connecting lines (n = 3) correspond to samples with decreased or unchanged number of autoantigens. Each line and connected squares correspond to one APECED patient with samples collected at different time points. The locations of the squares on y-scale correspond to the age of the patient when the samples were collected. The sizes of the blue and red squares correspond to the number of positive autoantigens in corresponding samples. (E) The change of autoantigen profiles in samples collected longitudinally. The two columns show the autoantibody reactivities in patient samples taken less than 10 or more than 10 years apart. The autoantigens were compared between the samples of the same patient and divided into three categories according to their specificity: (i) specific to early sample, (ii) shared in early and late sample, and (iii) specific to late sample. The numbers in columns indicate the proportions of each category. Samples taken more than 10 years apart show higher percentage of autoantigens in the late samples, indicating that the autoantibody repertoire gets broader with time.
Figure 5
Figure 5
Autoantibody correlation with APECED mutations and enrichment analysis for protein characteristics. (A) Correlation of the number of autoantibody targets with APECED mutations using pairwise comparisons with Tukey and Kramer (Nemenyi) test and Tukey-Dist approximation for independent samples. The first and the second mutation types are significantly different from the third type in terms of log2 of positive hits with p-values 0.0016 and 0.0072, respectively. (B) Association of autoantigens with different protein characteristics. Length of each bar is directly proportional to the significance of the term, calculated with hypergeometric test. False discovery rate was used to correct for multiple testing. Red line is drawn at 0.05 significance level. (C) Association of positive reactivities with tissue-specific gene groups from Human Protein Atlas. Hypergeometric test was used to compute displayed p-values and false discovery rate was used to correct for multiple testing.
Figure 6
Figure 6
Genetic polymorphisms and evolutionary conservation of APECED autoantigens. (A) Association of autoantigens with single nucleotide polymorphisms (SNPs). Two SNP categories were analyzed: the number of SNPs (i) within the boundaries of a gene (left histogram) and (ii) within exon regions of a gene (right histogram). For both histograms 10,000 randomly sampled groups of Protoarray proteins (genes) were generated with the size equal to the size of positive autoantigen group. On the x-axis the average number of SNPs is shown. The red dashed line shows the number of SNPs in positive autoantigen group. The p-value for each category of SNPs has been calculated in order to estimate the significance of a difference between randomly sampled groups and positive group. The autoantigen group has lower mean normalized SNP count, then it would be expected on average for the genes encoding proteins on Protoarray. (B) Evolutionary conservation rate. The four histograms that show distribution of average evolution rates for 10,000 randomly sampled groups of Protoarray genes were generated with the size equal to the size of positive autoantigen group. Each histogram represents a comparison of positive autoantigen group with ortholog genes in different evolutionary categories (all, metazoa, mammalia, or vertebrata species). On the x-axis the average evolutionary rate is shown. The red dashed line represents an average evolutionary rate of positive autoantigen group. Computed p-values indicate that autoantigens are on average more conserved in categories all and metazoa than the rest of the genes encoding proteins on Protoarray.
Figure 7
Figure 7
Medullary thymic epithelial cells (mTEC) specific expression of tissue-restricted (TR) APECED autoantigens. TR APECED autoantigens but not the non-tissue-restricted (NTR) autoantigens were upregulated in mature Aire-expressing mTECs. Datalists [generated by Sansom et al. (42)] of differentially expressed genes in mTEC subsets were compared to the list of APECED autoantigens. Strong enrichment of TR autoantigens was found among differentially upregulated genes in mature mTEC subpopulation in comparison to (i) immature mTECs, (ii) Aire-negative mTECs, and (iii) Aire-knockout mTEC populations. Blue circles mark the corresponding cell populations, the gradient in connecting lines indicate whether the genes in comparison were up- or downregulated, and the width of the lines represents the logarithmized p-value. No significant overlap was found among NTR autoantigens differentially expressed in any of the studied thymic cell comparisons.

References

    1. Goodnow CC, Vinuesa CG, Randall KL, Mackay F, Brink R. Control systems and decision making for antibody production. Nat Immunol (2010) 11(8):681–8. 10.1038/ni.1900 - DOI - PubMed
    1. Kisand K, Peterson P. Autoimmune polyendocrinopathy candidiasis ectodermal dystrophy. J Clin Immunol (2015) 35(5):463–78. 10.1007/s10875-015-0176-y - DOI - PubMed
    1. Abramson J, Husebye ES. Autoimmune regulator and self-tolerance – molecular and clinical aspects. Immunol Rev (2016) 271(1):127–40. 10.1111/imr.12419 - DOI - PubMed
    1. Mathis D, Benoist C. Aire. Annu Rev Immunol (2009) 27:287–312. 10.1146/annurev.immunol.25.022106.141532 - DOI - PubMed
    1. Peterson P, Org T, Rebane A. Transcriptional regulation by AIRE: molecular mechanisms of central tolerance. Nat Rev Immunol (2008) 8(12):948–57. 10.1038/nri2450 - DOI - PMC - PubMed

LinkOut - more resources