

Multi-parameter comparison of a standardized mixed meal tolerance test in healthy and type 2 diabetic subjects: the PhenFlex challenge
- PMID: 28861127
- PMCID: PMC5576306
- DOI: 10.1186/s12263-017-0570-6
Multi-parameter comparison of a standardized mixed meal tolerance test in healthy and type 2 diabetic subjects: the PhenFlex challenge
Abstract
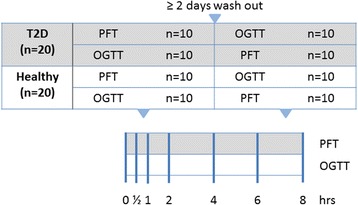
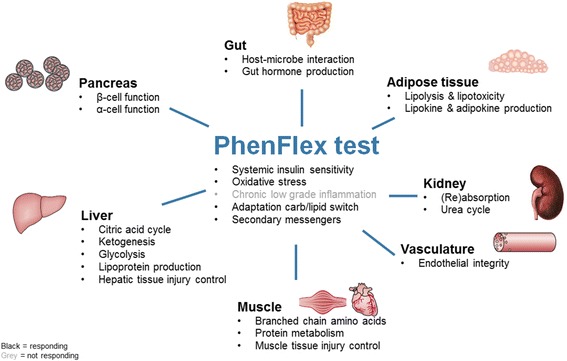
Background: A key feature of metabolic health is the ability to adapt upon dietary perturbations. Recently, it was shown that metabolic challenge tests in combination with the new generation biomarkers allow the simultaneous quantification of major metabolic health processes. Currently, applied challenge tests are largely non-standardized. A systematic review defined an optimal nutritional challenge test, the "PhenFlex test" (PFT). This study aimed to prove that PFT modulates all relevant processes governing metabolic health thereby allowing to distinguish subjects with different metabolic health status. Therefore, 20 healthy and 20 type 2 diabetic (T2D) male subjects were challenged both by PFT and oral glucose tolerance test (OGTT). During the 8-h response time course, 132 parameters were quantified that report on 26 metabolic processes distributed over 7 organs (gut, liver, adipose, pancreas, vasculature, muscle, kidney) and systemic stress.
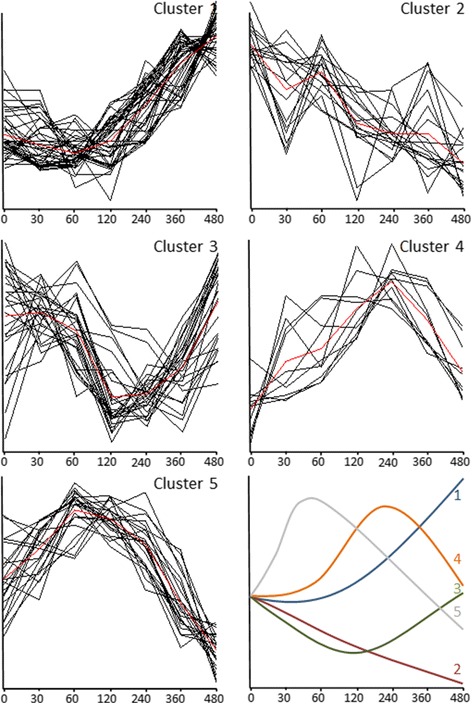
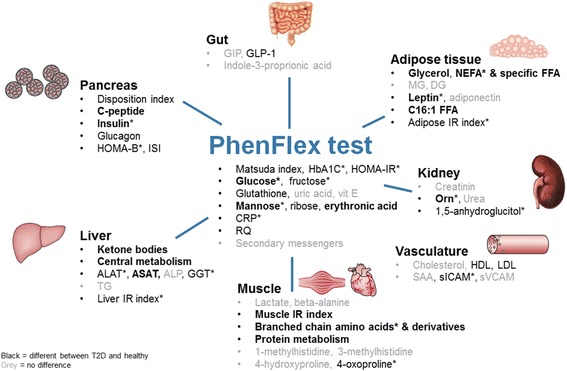
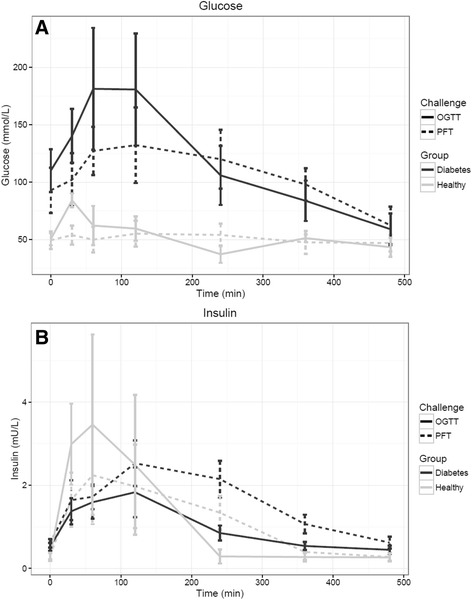
Results: In healthy subjects, 110 of the 132 parameters showed a time course response. Patients with T2D showed 18 parameters to be significantly different after overnight fasting compared to healthy subjects, while 58 parameters were different in the post-challenge time course after the PFT. This demonstrates the added value of PFT in distinguishing subjects with different health status. The OGTT and PFT response was highly comparable for glucose metabolism as identical amounts of glucose were present in both challenge tests. Yet the PFT reports on additional processes, including vasculature, systemic stress, and metabolic flexibility.
Conclusion: The PFT enables the quantification of all relevant metabolic processes involved in maintaining or regaining homeostasis of metabolic health. Studying both healthy subjects and subjects with impaired metabolic health showed that the PFT revealed new processes laying underneath health. This study provides the first evidence towards adopting the PFT as gold standard in nutrition research.
Keywords: Biomarkers; Metabolic health; Nutrition; Nutritional challenge test; Phenotypic flexibility; Type 2 diabetes.
Conflict of interest statement
Ethics approval and consent to participate
All subjects gave written informed consent, and the study was approved by the Medical Ethics Committee of Leiden University Medical Centre (LUMC), The Netherlands. The study was conducted according to the principles of the Declaration of Helsinki and in accordance with the Dutch Medical Research in Human Subjects Act (WMO) and registered at the Central Committee for Medical Research under number: NL41396.058.12 and registered at ISRCTN registry with study ID ISRCTN27707180 (
Consent for publication
Not applicable.
Competing interests
The authors declare that they have no competing interests.
Publisher’s Note
Springer Nature remains neutral with regard to jurisdictional claims in published maps and institutional affiliations.
Figures
References
-
- Huber M, Knottnerus JA, Green L, van der Horst H, Jadad AR, Kromhout D, et al. How should we define health? BMJ [Internet]. 2011 [cited 2016 May 4];343:d4163. Available from: http://www.ncbi.nlm.nih.gov/pubmed/21791490 - PubMed
-
- van Ommen B, Keijer J, Heil SG, Kaput J. Challenging homeostasis to define biomarkers for nutrition related health. Mol. Nutr. Food Res. [Internet]. 2009 [cited 2016 May 4];53:795–804. Available from: http://www.ncbi.nlm.nih.gov/pubmed/19517455 - PubMed
-
- Stroeve JHM, van Wietmarschen H, Kremer BHA, van Ommen B, Wopereis S. Phenotypic flexibility as a measure of health: the optimal nutritional stress response test. Genes Nutr. [Internet]. 2015 [cited 2016 May 4];10:459. Available from: http://www.ncbi.nlm.nih.gov/pubmed/25896408 - PMC - PubMed
-
- van Ommen B, van der Greef J, Ordovas JM, Daniel H. Phenotypic flexibility as key factor in the human nutrition and health relationship. Genes Nutr. [Internet]. 2014 [cited 2016 May 4];9:423. Available from: http://www.ncbi.nlm.nih.gov/pubmed/25106484 - PMC - PubMed
-
- van Ommen B, Wopereis S. Next-generation biomarkers of health. Nestlé Nutr. Inst. Work. Ser. [Internet]. 2016 [cited 2016 May 10];84:25–33. Available from: https://www.ncbi.nlm.nih.gov/pubmed/26764470 - PubMed
LinkOut - more resources
Full Text Sources
Other Literature Sources
Medical
