

Alteration of Interneuron Immunoreactivity and Autophagic Activity in Rat Hippocampus after Single High-Dose Whole-Brain Irradiation
- PMID: 28861331
- PMCID: PMC5576964
- DOI: 10.7759/cureus.1414
Alteration of Interneuron Immunoreactivity and Autophagic Activity in Rat Hippocampus after Single High-Dose Whole-Brain Irradiation
Abstract
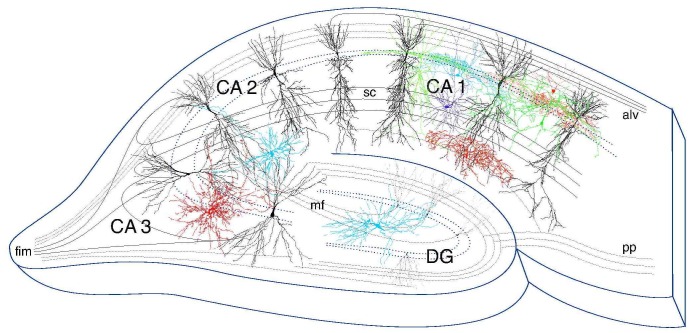
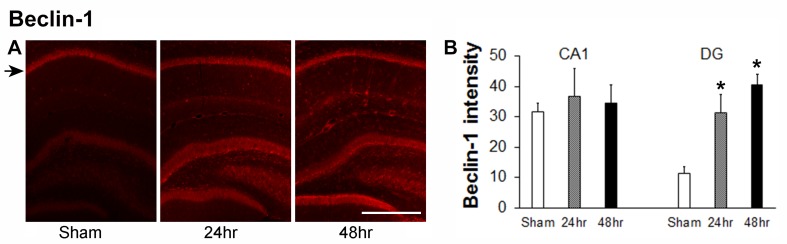
The effects of high dose gamma radiation on brain tissue are poorly understood, with both limited and major changes reported. The present study compared the effects of gamma irradiation on the expression of interneuron markers within the hippocampal cornu ammonis 1 (CA1) region with expression in control matched rats. This area was chosen for study because of its well-characterized circuitry. Male Sprague-Dawley rats were exposed to 60 Gy of whole brain gamma radiation and after 24 or 48 hours, the brains were removed, fixed and sectioned to quantitate expression of parvalbumin (PV), calbindin-D28K (CB), reelin, neuropeptide-Y (NPY), and somatostatin. All of these markers increased in expression over the first 48 hours, except NPY, which decreased. This provides novel information on changes in gene expression in the hippocampal interneurons following radiation. Staining for Beclin 1, a marker of autophagy, increased most strongly in the subgranular zone (SGZ) of the dentate gyrus (DG). Overall, the results are consistent with the hypothesis that increased intracellular calcium follows irradiation, leading to an increased expression of calcium binding proteins. Increased autophagy occurs in the neurogenic zone of the dentate hilus, consistent with reduced effective neurogenesis after irradiation.
Keywords: autophagy; calbindin; hippocampus; interneurons; neuropeptide y; parvalbumin; reelin; whole-brain radiation.
Conflict of interest statement
The authors have declared that no competing interests exist.
Figures


Similar articles
-
Calcium-binding protein (calbindin-D28k) and parvalbumin immunocytochemistry: localization in the rat hippocampus with specific reference to the selective vulnerability of hippocampal neurons to seizure activity.J Comp Neurol. 1989 Feb 8;280(2):183-96. doi: 10.1002/cne.902800203. J Comp Neurol. 1989. PMID: 2925892
-
Neurocalcin-immunoreactive cells in the rat hippocampus are GABAergic interneurons.Hippocampus. 1998;8(1):2-23. doi: 10.1002/(SICI)1098-1063(1998)8:1<2::AID-HIPO2>3.0.CO;2-P. Hippocampus. 1998. PMID: 9580316
-
Substance P receptor expression by inhibitory interneurons of the rat hippocampus: enhanced detection using improved immunocytochemical methods for the preservation and colocalization of GABA and other neuronal markers.J Comp Neurol. 2001 Feb 12;430(3):283-305. J Comp Neurol. 2001. PMID: 11169468
-
Maternal exposure to 3,3'-iminodipropionitrile targets late-stage differentiation of hippocampal granule cell lineages to affect brain-derived neurotrophic factor signaling and interneuron subpopulations in rat offspring.J Appl Toxicol. 2015 Aug;35(8):884-94. doi: 10.1002/jat.3086. Epub 2014 Nov 25. J Appl Toxicol. 2015. PMID: 25424614
-
Interneurons in rat hippocampus after cerebral ischemia. Morphometric, functional, and therapeutic investigations.Acta Neurol Scand Suppl. 1993;150:1-32. Acta Neurol Scand Suppl. 1993. PMID: 7907456 Review.
Cited by
-
Neuroprotective agents effective against radiation damage of central nervous system.Neural Regen Res. 2022 Sep;17(9):1885-1892. doi: 10.4103/1673-5374.335137. Neural Regen Res. 2022. PMID: 35142663 Free PMC article. Review.
-
Effects of radiotherapy on the hippocampus and hippocampal neurogenesis: a systematic review of preclinical studies.Strahlenther Onkol. 2025 Apr;201(4):383-397. doi: 10.1007/s00066-024-02341-4. Epub 2025 Jan 12. Strahlenther Onkol. 2025. PMID: 39800777
-
The Neuroprotective Effect of Amitriptyline on Radiation-Induced Impairment of Hippocampal Neurogenesis.Dose Response. 2019 Dec 20;17(4):1559325819895912. doi: 10.1177/1559325819895912. eCollection 2019 Oct-Dec. Dose Response. 2019. PMID: 31903069 Free PMC article.
References
-
- Gamma-knife subcaudate tractotomy for treatment-resistant depression and target characteristics: a case report and review. Park SC, Lee JK, Kim CH, Hong JP, Lee DH. Acta Neurochirurgica. 2017;159:113–120. - PubMed
-
- Long-term safety and efficacy of Gamma Knife surgery in classical trigeminal neuralgia: a 497-patient historical cohort study. Regis J, Tuleasca C, Resseguier N, et al. J Neurosurg. 2016;124:1079–1087. - PubMed
-
- The epidemiology of major depressive disorder: results from the National Comorbidity Survey Replication (NCS-R) Kessler RC, Berglund P, Demler O, et al. JAMA. 2003;289:3095–3105. - PubMed
LinkOut - more resources
Full Text Sources
Other Literature Sources
Miscellaneous