. 2017 Aug 23;2(4):e00243-17.
doi: 10.1128/mSphere.00243-17. eCollection 2017 Jul-Aug.

Butyrate Supplementation at High Concentrations Alters Enteric Bacterial Communities and Reduces Intestinal Inflammation in Mice Infected with Citrobacter rodentium

Affiliations

Butyrate Supplementation at High Concentrations Alters Enteric Bacterial Communities and Reduces Intestinal Inflammation in Mice Infected with Citrobacter rodentium

Janelle A Jiminez et al. mSphere. .

Abstract

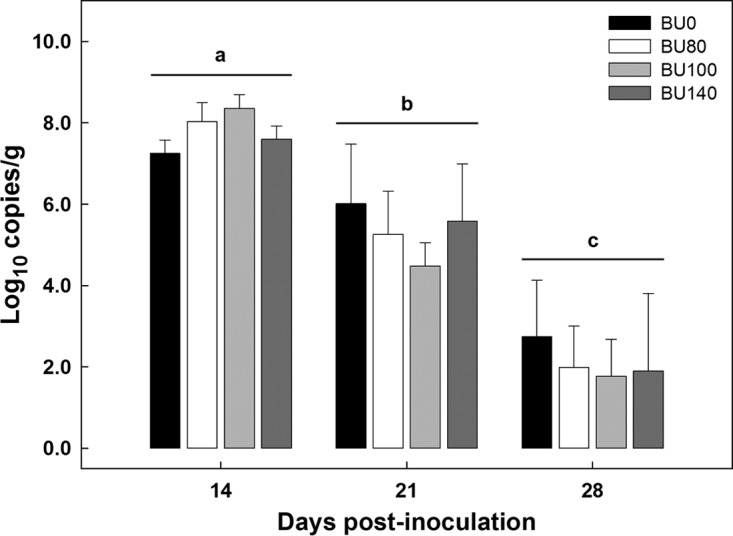
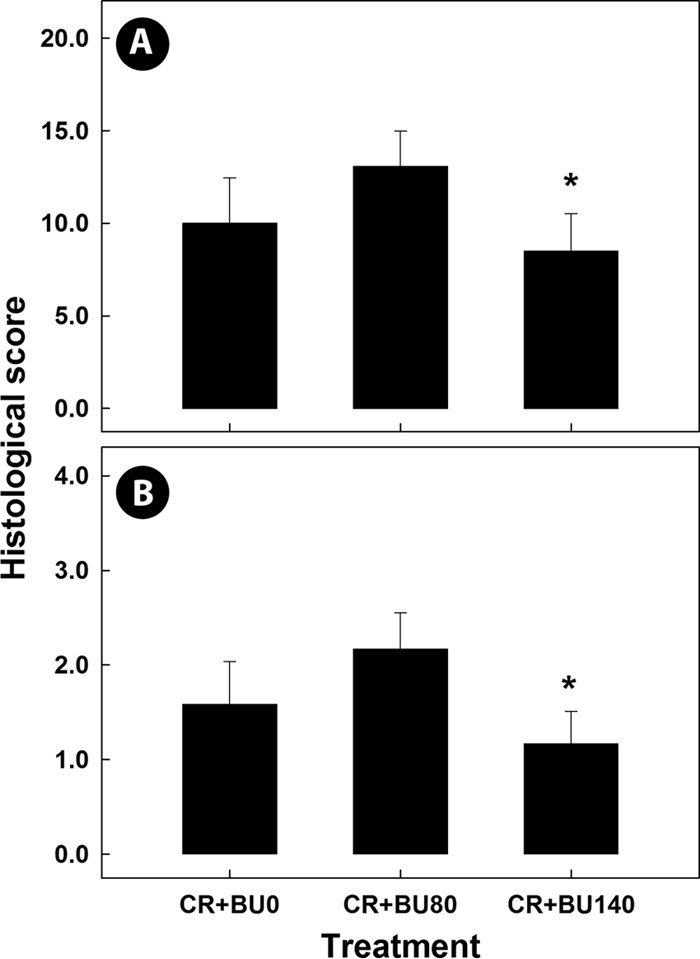
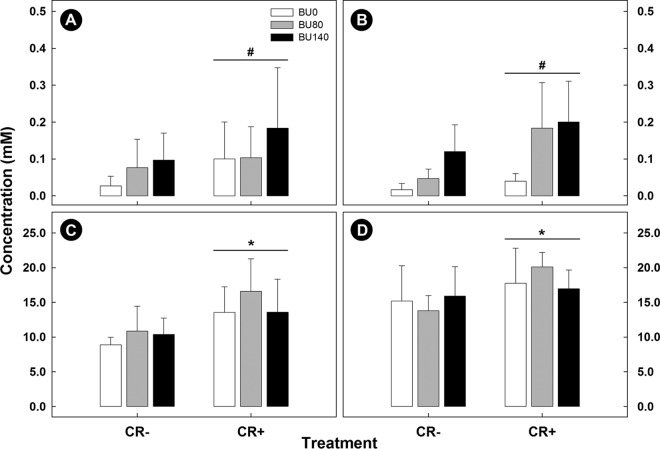
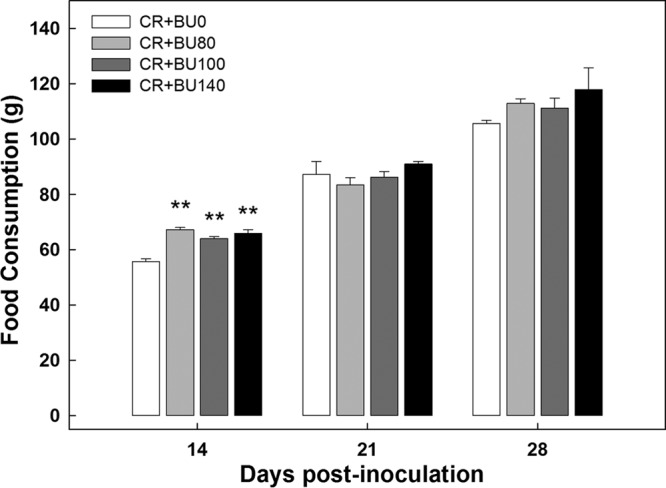
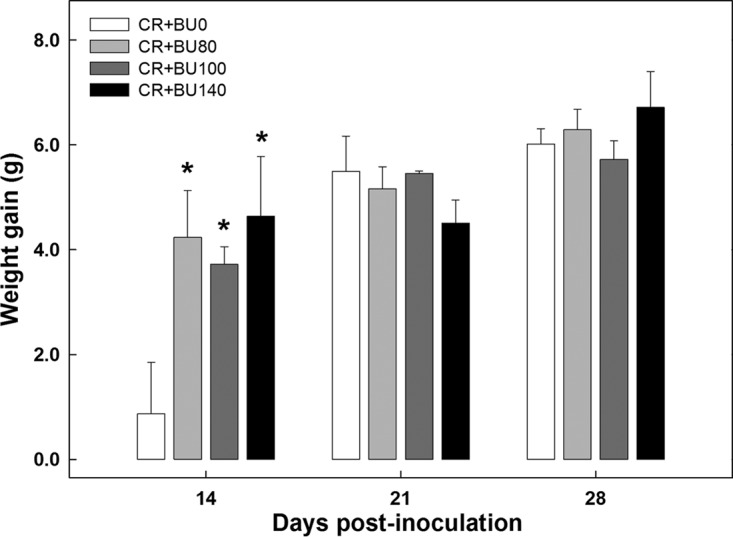
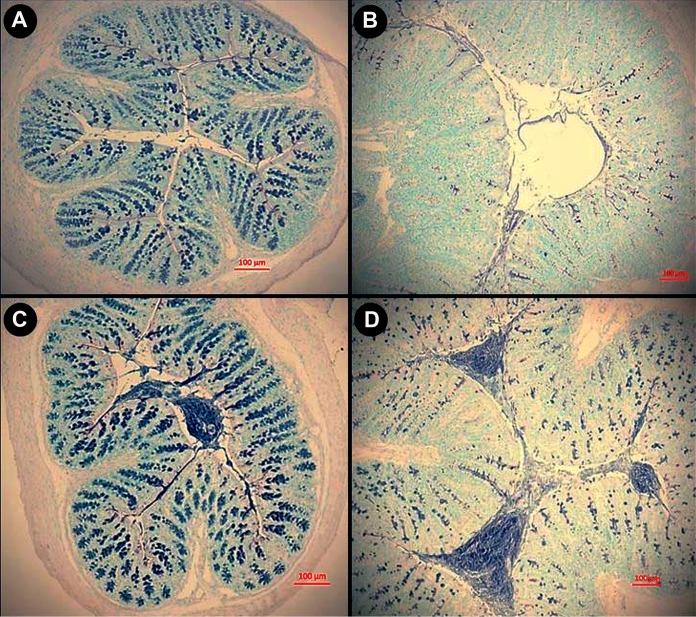
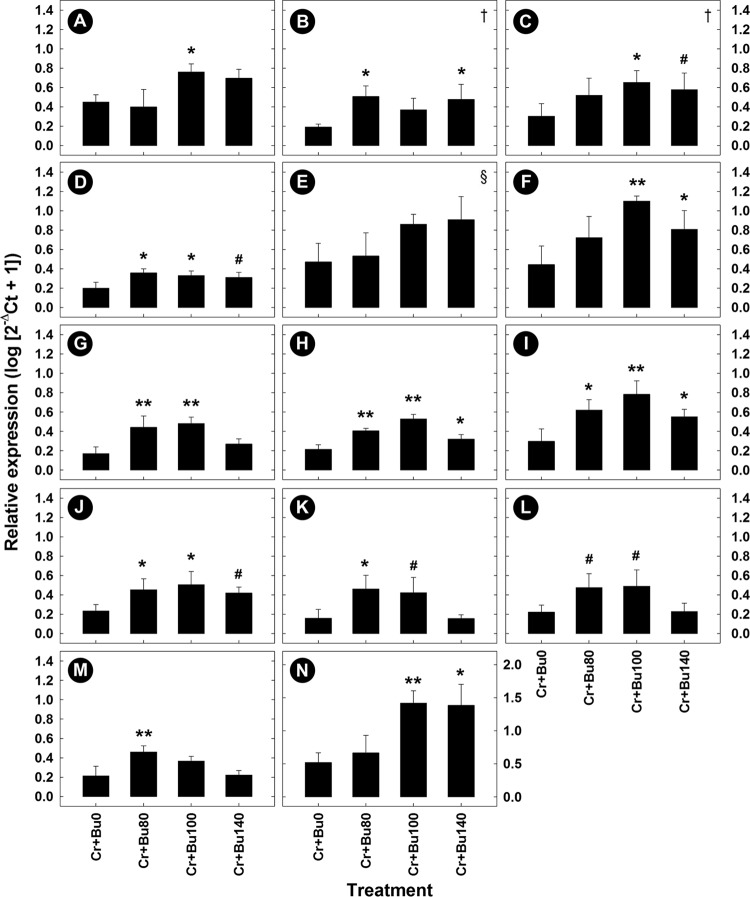
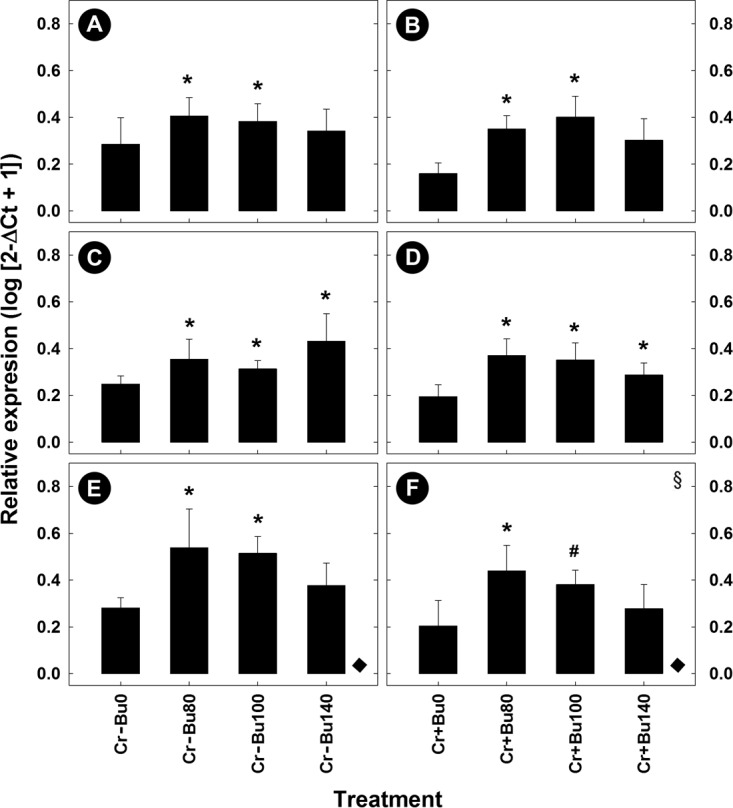
Butyrate is a short-chain fatty acid by-product of the microbial fermentation of dietary fermentable materials in the large intestine; it is the main energy source for enterocyte regeneration, modulates the enteric microbial community, and contributes to increasing host health via mechanisms that are relatively poorly defined. Limited research has examined the therapeutic potential of butyrate using models of enteric inflammation incited by pathogenic organisms. We used Citrobacter rodentium to incite acute Th1/Th17 inflammation to ascertain the impact of butyrate on the host-microbiota relationship. Rectal administration of 140 mM butyrate to mice increased fecal concentrations of butyrate and increased food consumption and weight gain in mice infected with C. rodentium. Histological scores of colonic inflammation were lower in infected mice administered 140 mM butyrate. Expression of Il10, Tgfβ, and Muc2 was elevated in noninfected mice administered butyrate in comparison to mice not administered butyrate. Infected mice administered butyrate displayed elevated expression of genes necessary for pathogen clearance (i.e., Il17A and Il1β) and of genes involved in epithelial barrier repair and restoration (i.e., Relmβ, Tff3, and Myd88). Butyrate supplemented to inflamed colons increased the abundances of Proteobacteria and Lachnospiraceae and reduced the abundance of Clostridiaceae species. Mice with enteritis that were administered butyrate also exhibited an increased abundance of mucus-associated bacteria. In summary, rectal administration of butyrate increased feed consumption and weight gain, ameliorated C. rodentium-induced cell injury through enhanced expression of immune regulation and tissue repair mechanisms, and increased the abundance of butyrate-producing bacteria in mice with enteritis. IMPORTANCE The study findings provide evidence that administration of butyrate in a dose-dependent manner can increase weight gain in infected mice, enhance clearance of the infection, reduce inflammation through altered cytokine expression, and enhance tissue repair and mucus secretion. Moreover, butyrate treatment also affected the abundance of bacterial populations in both noninflamed and inflamed intestines. Notably, this investigation provides foundational information that can be used to determine the effects of prebiotics and other functional foods on the production of butyrate by enteric bacteria and their impact on intestinal health and host well-being.

Keywords: Citrobacter rodentium; butyrate; inflammation; intestine; mice; microbiota.


Figures

FIG 1
FIG 1
Densities of C. rodentium in feces from mice inoculated with the bacterium and rectally administered PBS (BU0) or butyrate at a concentration of 80 mM (BU80), 100 mM (BU100), or 140 mM (BU140) from the point of inoculation to day 28 postinoculation. No C. rodentium was detected in feces from mice not inoculated with the bacterium. Vertical lines associated with bars represent standard errors of the means (n = 4). There was no difference (P = 0.965) in the densities of C. rodentium among the butyrate treatments, but densities differed (P < 0.001) among the three sample times. Time groups not indicated by the same letter differ (P ≤ 0.012).
FIG 2
FIG 2
Histopathologic changes in colonic tissue from mice inoculated with C. rodentium (CR) and rectally administered PBS (BU0) or butyrate at concentrations of 80 mM (BU80) and 140 mM (BU140) averaged over peak and late infection. (A) Total histopathologic scores. (B) Epithelial cell hyperplasia. Vertical lines associated with histogram bars represent standard errors of the means (n = 4). *, P < 0.050 (relative to the BU0 treatment). For all treatments, histopathologic changes were reduced over time (P ≤ 0.005) in mice infected with C. rodentium.
FIG 3
FIG 3
Concentrations of butyrate and total short-chain fatty acids (SCFA) measured in feces from mice inoculated with PBS (CR−) or C. rodentium (CR+) via gavage and rectally administered PBS (BU0) or butyrate at concentrations of 80 mM (BU80) and 140 mM (BU140). Samples were collected on days 14 and 21 postinoculation (p.i.). (A) Butyrate concentrations in feces collected on day 14 p.i. (B) Butyrate concentrations in feces collected on day 21 p.i. (C) Total SCFA concentrations in feces collected on day 14 p.i. (D) Total SCFA concentrations in feces collected on day 21 p.i. Vertical lines associated with histogram bars represent standard errors of the means (n = 4). #, P ≤ 0.073 (between infected and noninfected mice). *, P ≤ 0.020 (between infected and noninfected mice).
FIG 4
FIG 4
Daily food consumption in mice inoculated with C. rodentium (CR+) and rectally administered PBS (BU0) or butyrate at concentrations of 80 mM (BU80), 100 mM (BU100), and 140 mM (BU140). Vertical lines associated with markers represent standard errors of the means (n = 4). **, P ≤ 0.010 (relative to the BU0 treatment on day 14 postinoculation).
FIG 5
FIG 5
Weight gain in mice inoculated with C. rodentium (CR+) and rectally administered PBS (BU0) or butyrate at concentrations of 80 mM (BU80), 100 mM (BU100), and 140 mM (BU140). Vertical lines associated with histogram bars represent standard errors of the means (n = 4). *, P ≤ 0.050 (relative to the BU0 treatment).
FIG 6
FIG 6
Mucus localization in alcian blue–periodic acid-Schiff-stained sections from the distal colons of mice inoculated with PBS (CR−) or C. rodentium (CR+) and rectally administered PBS (BU0) or butyrate at a concentration of 140 mM (BU140) at day 14 p.i. (A) CR–, BU0. (B) CR+, BU0. (C) CR–, BU140. (D) CR+, BU140. Tissue from infected mice administered butyrate exhibited a consistent increase in the density of mucus (blue stain) within goblet cells and the colonic lumen. Bars, 100 µm.
FIG 7
FIG 7
Relative mRNA gene expression profiles of cytokine-related innate barrier function and host pathogen recognition genes measured in colonic tissue harvested from mice inoculated with C. rodentium (CR) and with rectally administered PBS (BU0) or butyrate at concentrations of 80 mM (BU80), 100 mM (BU100), and 140 mM (BU140) averaged over time. (A) Il17A. (B) Il22. (C) Il1β. (D) MyD88. (E) RegIIIγ. (F) Ifnγ. (G) Tlr9. (H) Tlr2. (I) Tnfα. (J) Ltb4R1. (K) Prg3. (L) Il4. (M) Tff3. (N) Relmβ. Vertical lines associated with histogram bars represent standard errors of the means (n = 4). #, P ≤ 0.100; *, P ≤ 0.050; **, P ≤ 0.010 (relative to the BU0 treatment). †, the statistical value represents a difference determined by excluding a butyrate treatment and comparing CR+ BU0 treatment to only two of the three other treatments; §, the statistical value represents comparison between CR+ BU0 treatment and CR+ BU100 treatment only. Ct, threshold cycle.
FIG 8
FIG 8
Relative mRNA gene expression profiles of regulatory cytokines and mucus-producing genes in colonic tissue harvested from mice inoculated with PBS (CR−) or C. rodentium (CR+) and rectally administered PBS (BU0) or butyrate at concentrations of 80 mM (BU80), 100 mM (BU100), and 140 mM (BU140). (A and B) Il10. (C and D) Tgfβ. (E and F) Muc2. Vertical lines associated with histogram bars represent standard errors of the means (n = 4). #, P ≤ 0.100; *, P ≤ 0.050 (relative to the BU0 treatment). ♦, P = 0.053 (representing the difference in overall Muc2 expression due to C. rodentium infection). §, the statistical value represents a difference determined by excluding a butyrate treatment and comparing CR+ BU0 treatment to only two of the three other treatments.
FIG 9
FIG 9
Effects of rectal administration of PBS (BU0) or 140 mM butyrate (BU140) on bacterial community structures in the distal colon of mice (mucosa-associated and within digesta) inoculated with PBS (CR−) or C. rodentium (CR+) as determined by weighted UniFrac analysis. Axes identify percent variation among treatments, and ellipsoids are used to highlight clustering of communities by treatment. (A and B) Mice with (CR+) and without (CR−) enteritis. (C and D) Mice without enteritis (CR−). (A) Mucosa-associated. (B) Digesta. The shaded ellipsoid highlights clustering of communities from CR− BU0 treatment mice, and the open ellipsoid highlights clustering of communities from CR− BU140 treatment mice; a butyrate effect was observed for the CR− treatments (P = 0.071 with 753 random permutations). (C) Mucosa-associated. (D) Digesta. The shaded ellipsoid highlights clustering of communities from CR− BU0 treatment mice, and the open ellipsoid highlights clustering of communities from CR− BU140 treatment mice; a butyrate effect was observed (P = 0.071 with 762 random permutations).
FIG 10
FIG 10
Phylogenetic trees of bacteria associated with mucosa and within digesta in the distal colons of mice with (CR+) and without (CR−) enteritis and rectally administered PBS (BU0) or 140 mM butyrate (BU140) as determined using the linear discriminant analysis effect size (LEfSe) method (LDA value, >2.0). The abundances of bacterial taxa highlighted in blue differed (P ≤ 0.050) between the BU0 and BU140 treatments. (A) Mucosa-associated. (B) Digesta. Data to construct the phylogenetic trees used summarized taxonomic values per treatment averaged over four replications.
FIG 11
FIG 11
Changes observed in mucosa- and digesta-associated bacterial communities within the distal colon at peak infection and late infection, including the overall butyrate effect. Green boxes indicate a significant (P ≤ 0.100) increase in the abundance of specified taxa supplemented with butyrate (BU140) compared to the PBS control (BU0) within each enteritis treatment group. Red boxes indicate a significant (P ≤ 0.100) decrease in the abundance of specified taxa supplemented with butyrate (BU140) compared to butyrate control taxa (BU0) within each enteritis treatment group. p, phylum; c, class; o, order; f, family; g, genus. A butyrate effect was defined as a significant increase or decrease in bacterial abundance in response to butyrate administration averaged over time.
FIG 12
FIG 12
Abundance of bacteria within the distal colon of mice inoculated with PBS (CR−) or C. rodentium (CR+) and rectally administered PBS (BU0) or butyrate at a concentration of 140 mM (BU140). (A) Mucosa-associated. (B) Digesta. Vertical lines associated with histogram bars represent standard errors of the means (n = 4). #, P ≤ 0.100; *, P ≤ 0.050 (comparing butyrate treatment effects within CR− mice [BU0 to BU140] and CR+ mice [BU0 to BU140]).
FIG 13
FIG 13
Localization of Gammaproteobacteria and evidence of Proteobacteria migration into the crypts within the distal colon of mice inoculated with C. rodentium (CR+) and rectally administered PBS (BU0) or butyrate at a concentration of 140 mM (BU140). (A) Abundance of Enterobacteriaceae and Gammaproteobacteria associated with the mucosa on day 14 postinoculation (p.i.) in mice inoculated with PBS and C. rodentium (B) Abundance of Enterobacteriaceae and Gammaproteobacteria associated with mucosa on day 21 p.i. in mice inoculated with PBS and C. rodentium. Vertical lines associated with histogram bars represent standard errors of the means (n = 4). **, P ≤ 0.010 (for treatments linked by the horizontal lines). (C to F) Fluorescence micrographs of distal colonic tissue hybridized with a Gammaproteobacteria probe (red). (C) CR+ BU− at day 14 p.i. (bar, 200 µm). (D) CR+ BU+ at day 14 p.i. (bar, 200 µm). (E) CR+ BU− at day 21 p.i. (bar, 100 µm). (F) CR+ BU+ at day 21 p.i. (bar, 200 µm). The arrows indicate subluminal Proteobacteria.

References

    1. Lin HV, Frassetto A, Kowalik EJ Jr, Nawrocki AR, Lu MM, Kosinski JR, Hubert JA, Szeto D, Yao X, Forrest G, Marsh DJ. 2012. Butyrate and propionate protect against diet-induced obesity and regulate gut hormones via free fatty acid receptor 3-independent mechanisms. PLoS One 7:e35240. doi:10.1371/journal.pone.0035240. - DOI - PMC - PubMed
    1. Cummings JH, Pomare EW, Branch WJ, Naylor CP, Macfarlane GT. 1987. Short chain fatty acids in human large intestine, portal, hepatic and venous blood. Gut 28:1221–1227. doi:10.1136/gut.28.10.1221. - DOI - PMC - PubMed
    1. Cummings JH. 1984. Colonic absorption: the importance of short chain fatty acids in man. Scand J Gastroenterol Suppl 93:89–99. - PubMed
    1. Leonel AJ, Alvarez-Leite JI. 2012. Butyrate: implications for intestinal function. Curr Opin Clin Nutr Metab Care 15:474–479. doi:10.1097/MCO.0b013e32835665fa. - DOI - PubMed
    1. Barcelo A, Claustre J, Moro F, Chayvialle JA, Cuber JC, Plaisancié P. 2000. Mucin secretion is modulated by luminal factors in the isolated vascularly perfused rat colon. Gut 46:218–224. doi:10.1136/gut.46.2.218. - DOI - PMC - PubMed

LinkOut - more resources