. 2017 Aug 23;2(4):e00295-17.
doi: 10.1128/mSphere.00295-17. eCollection 2017 Jul-Aug.

Arginine Exposure Decreases Acidogenesis in Long-Term Oral Biofilm Microcosms

Affiliations

Arginine Exposure Decreases Acidogenesis in Long-Term Oral Biofilm Microcosms

Ruth G Ledder et al. mSphere. .

Abstract

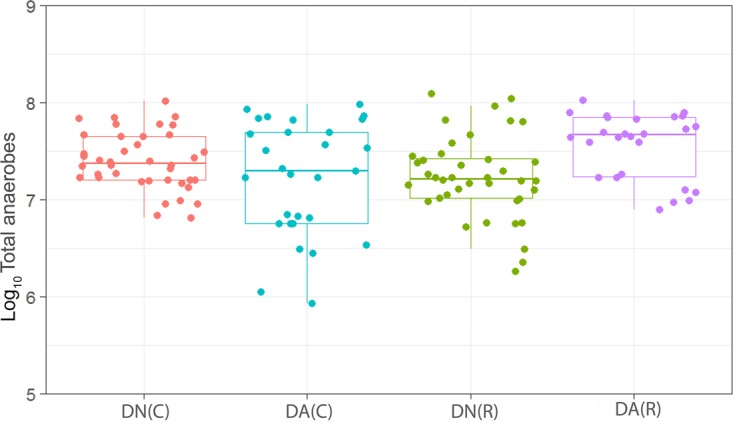
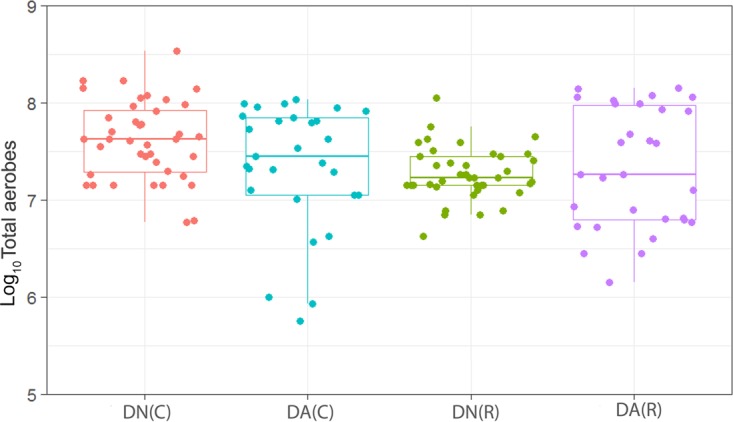
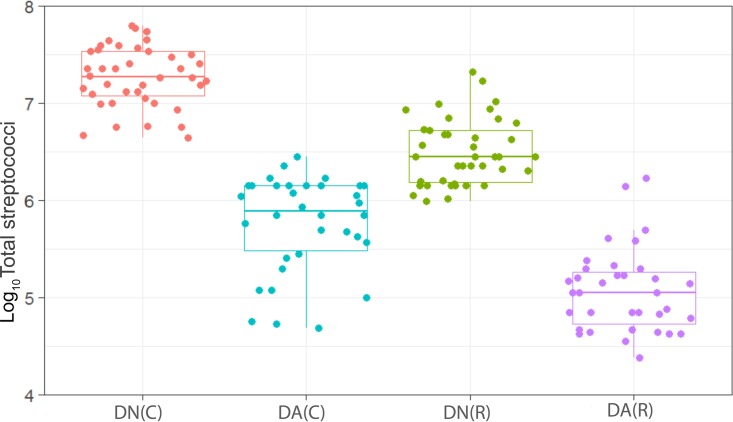
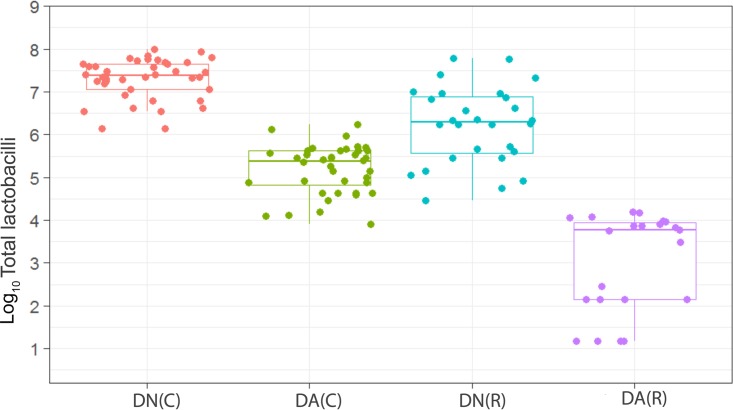
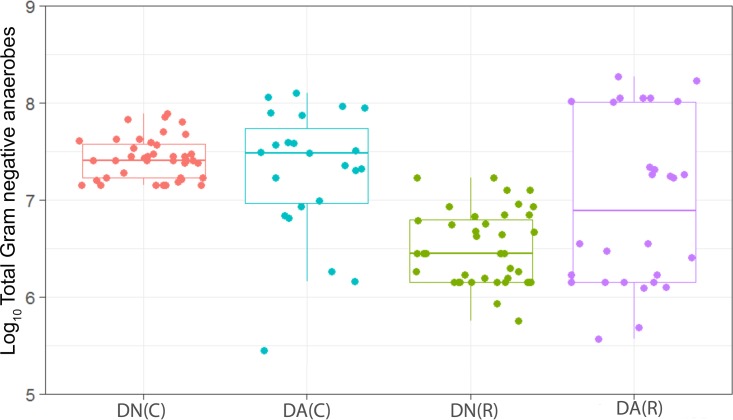
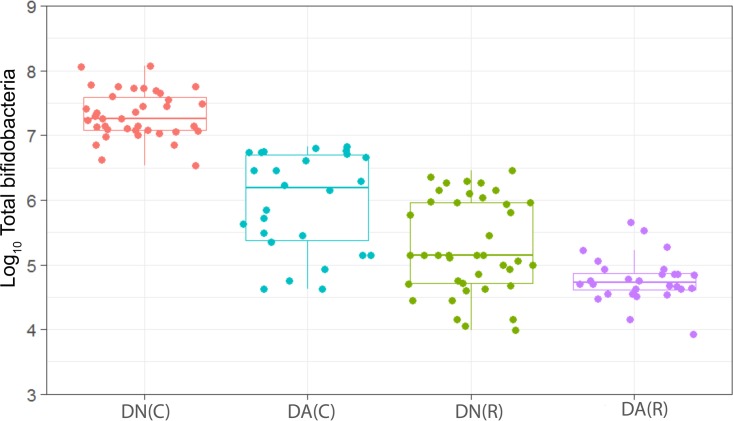
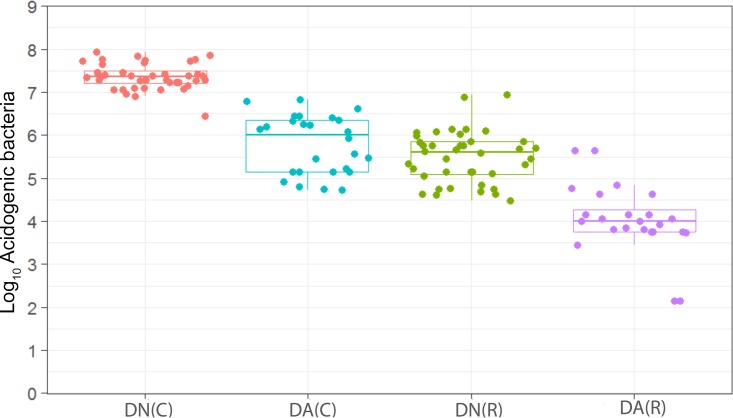
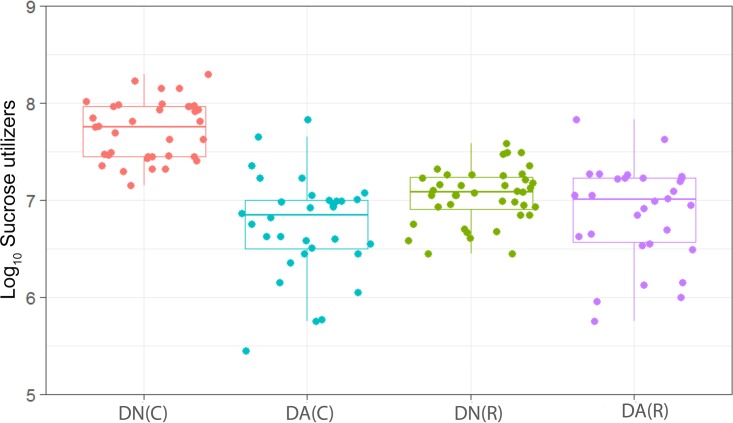
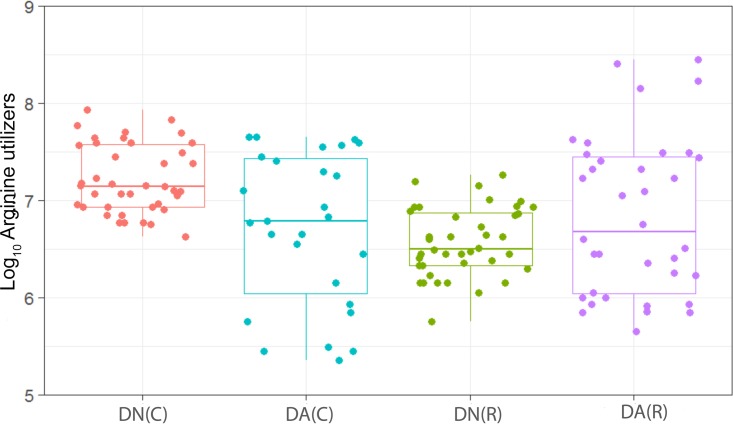
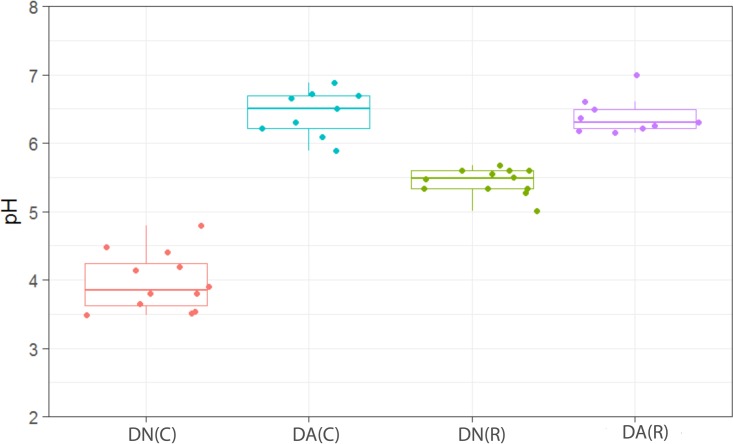
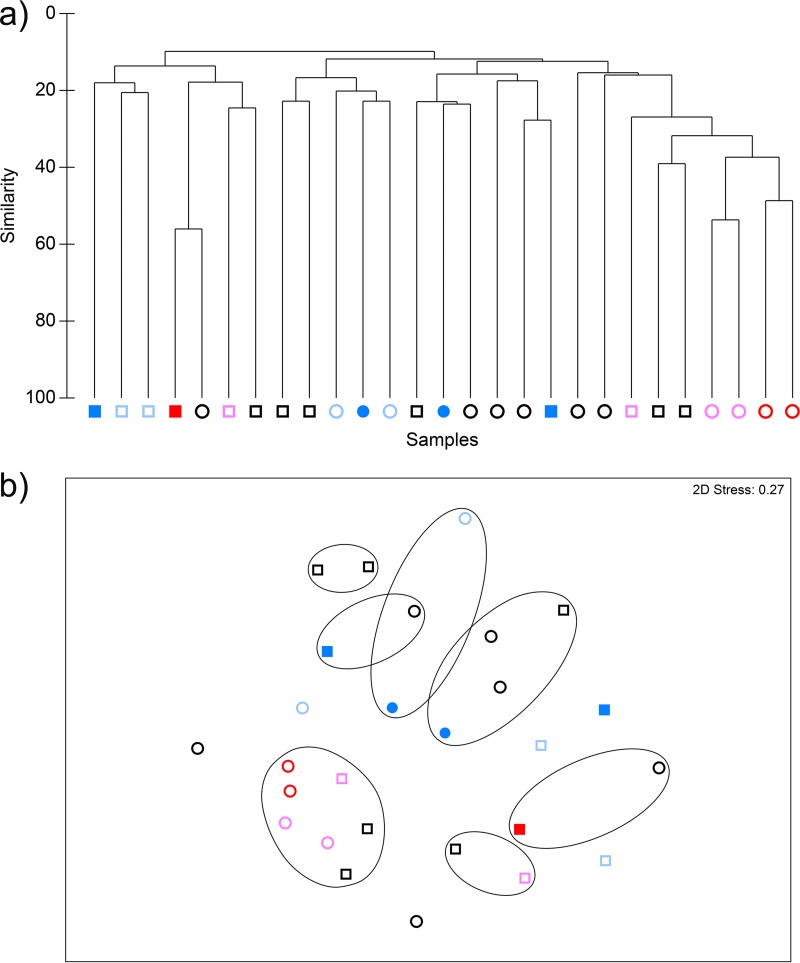
Arginine is an important pH-elevating agent in the oral cavity. It has been incorporated in oral hygiene formulations to mitigate sensitivity and to prevent caries. In this investigation, the effects of sustained arginine dosing of dental plaque microcosms on bacteriological composition and pH were evaluated under controlled conditions. Plaque microcosms were established in constant-depth film fermentors (CDFFs) using salivary inocula and fed continuously with artificial saliva. To simulate resting and cariogenic states, the CDFFs were supplemented with sterile water or 5% sucrose, respectively. Plaques were then dosed twice daily with a dentifrice with 1.5% arginine arginine added (DA) or without arginine (DN). This regimen continued for over 3 weeks, after which fermentors were maintained without dosing. Microcosms were analyzed by differential viable counting, with a pH microelectrode, and by eubacterial DNA profiling. Sucrose dosing was associated with significantly (P < 0.001) decreased pH, significantly (P < 0.05) increased counts of total aerobes, Gram-negative anaerobes, aciduric species, acidogenic species, arginine utilizing species, bifidobacteria, lactobacilli and streptococci, and significant (P < 0.05) changes in DNA profiles. Plaques dosed with DA had a significantly (P < 0.001) higher pH than those dosed with DN, with or without sucrose supplementation. Dosing with DA but not DN significantly (P < 0.05) decreased counts of all functional bacterial groups apart from the total anaerobes in cariogenic plaques, and in resting plaques, dosing with DA significantly (P < 0.05) decreased counts of streptococci, lactobacilli, bifidobacteria, and acidogenic bacteria. In summary, sustained exposure of oral microcosms to arginine in formulation significantly increased plaque pH and significantly reduced the viability of cariogenic bacterial species. IMPORTANCE Arginine is used in dental health formulations to help prevent dental cavities. This study assessed the effects of the long-term dosing of laboratory dental plaques with an arginine dentifrice. Data indicate that the addition of arginine dentifrice during sucrose challenge significantly increased plaque pH, thus potentially mitigating cariogenesis. Counts of several functional groups of bacteria associated with tooth decay were significantly decreased in the laboratory plaques during exposure to the arginine dentifrice.

Keywords: arginine; dental biofilm microcosm; dental plaque.


Figures

FIG 1
FIG 1
Distribution of the viable counts of total anaerobes in plaques dosed with (DA) and without (DN) arginine dentifrice in the presence (C, cariogenic) and absence (R, resting) of sucrose. Box plots: red, DN with sucrose; cyan, DA with sucrose; green, DN without sucrose; magenta, DA without sucrose. The horizontal bars within the boxes represent median values; the error bars indicate standard deviations. Each box plot represents the analysis of between 25 and 30 individual plaques. Dentifrice (DA or DN) and sucrose (5% [wt/vol]) or water were added to the fermentors every 6 h over a period of 22 to 29 days. Counts of total anaerobes were not significantly changed (P > 0.05) based on sucrose addition in plaques dosed with DN or based on DA addition in cariogenic plaques. Counts of total anaerobes were significantly (P = 0.035) higher in resting plaques dosed with DA than in those dosed with DN.
FIG 2
FIG 2
Distribution of the viable counts of total aerobes in plaques dosed with (DA) and without (DN) arginine dentifrice in the presence (C) and absence (R) of sucrose. Box plots: red, DN with sucrose; cyan, DA with sucrose; green; DN without sucrose; magenta, DA without sucrose. For details, see the legend to Fig. 1. Counts of total aerobes were significantly (P < 0.001) higher in cariogenic plaques dosed with DN than in resting plaques dosed with DN. Cariogenic plaque counts of total aerobes were significantly (P = 0.017) higher in DN-dosed plaques than in DA-dosed plaques. There was no significant difference (P = 0.60) between resting plaques dosed with DN and those dosed with DA.
FIG 3
FIG 3
Distribution of the viable counts of streptococci in plaques dosed with (DA) and without (DN) arginine dentifrice in the presence (C) and absence (R) of sucrose. Box plots: red, DN with sucrose; cyan, DA with sucrose; green, DN without sucrose; magenta, DA without sucrose. For details, see the legend to Fig. 1. Counts of streptococci were significantly (P < 0.001) higher in cariogenic plaques dosed with DN and with DA. Resting plaques dosed with DN had significantly (P < 0.001) higher counts of streptococci than those dosed with DA.
FIG 4
FIG 4
Distribution of the viable counts of lactobacilli in plaques dosed with (DA) and without (DN) arginine dentifrice in the presence (C) and absence (R) of sucrose. Box plots: red, DN with sucrose; cyan, DA with sucrose; green, DN without sucrose; magenta, DA without sucrose. For details, see the legend to Fig. 1. DN plaque counts in the presence of sucrose were significantly (P < 0.001) higher than DN and DA plaque counts in the absence of sucrose. DN counts in the absence of sucrose were significantly (P < 0.001) higher than DA plaque counts in the absence of sucrose. Counts of lactobacilli were significantly (P < 0.001) higher in cariogenic plaques dosed with DN and with DA. Resting plaques dosed with DN had significantly (P < 0.001) higher counts of lactobacilli than those dosed with DA.
FIG 5
FIG 5
Distribution of the viable counts of Gram-negative anaerobes in plaques dosed with (DA) and without (DN) arginine dentifrice in the presence (C) and absence (R) of sucrose. Box plots: red, DN with sucrose; cyan, DA with sucrose; green, DN without sucrose; magenta, DA without sucrose. For details, see the legend to Fig. 1. Counts of Gram-negative anaerobes were significantly (P < 0.001) higher in cariogenic plaques dosed with DN than in resting plaques. Cariogenic and resting plaques dosed with DA had significantly higher counts than plaques dosed with DN (P = 0.015 and P = 0.004, respectively).
FIG 6
FIG 6
Distribution of the viable counts of bifidobacteria in plaques dosed with (DA) and without (DN) arginine dentifrice in the presence (C) and absence (R) of sucrose. Box plots: red, DN with sucrose; cyan, DA with sucrose; green, DN without sucrose; magenta, DA without sucrose. For details, see the legend to Fig. 1. Counts of bifidobacteria were significantly (P < 0.001) higher in cariogenic plaques dosed with DN and with DA. Resting plaques dosed with DN had significantly (P < 0.001) higher counts of bifidobacteria than those dosed with DA.
FIG 7
FIG 7
Distribution of the viable counts of acid-producing species in plaques dosed with (DA) and without (DN) arginine dentifrice in the presence (C) and absence (R) of sucrose. Box plots: red, DN with sucrose; cyan, DA with sucrose; green, DN without sucrose; magenta, DA without sucrose. For details, see the legend to Fig. 1. Counts of acidogenic bacteria were significantly (P < 0.001) higher in cariogenic plaques dosed with DN and with DA. Resting plaques dosed with DN had significantly (P < 0.001) higher counts of acidogenic bacteria than those dosed with DA.
FIG 8
FIG 8
Distribution of the viable counts of sucrose-utilizing species in plaques dosed with (DA) and without (DN) arginine dentifrice in the presence (C) and absence (R) of sucrose. Box plots: red, DN with sucrose; cyan, DA with sucrose; green, DN without sucrose; magenta, DA without sucrose. For details, see the legend to Fig. 1. Counts of sucrose-utilizing bacteria were significantly (P < 0.001) higher in cariogenic plaques dosed with DN and with DA. Counts of sucrose-utilizing bacteria in resting plaques dosed with DN were not significantly (P = 0.065) changed in comparison to those dosed with DA.
FIG 9
FIG 9
Distribution of the viable counts of arginine-utilizing species in plaques dosed with (DA) and without (DN) arginine dentifrice in the presence (C) and absence (R) of sucrose. Box plots: red, DN with sucrose; cyan, DA with sucrose; green, DN without sucrose; magenta, DA without sucrose. For details, see the legend to Fig. 1. Counts of arginine-utilizing bacteria were significantly (P < 0.001) higher in cariogenic plaques dosed with DN and with DA. Counts of arginine-utilizing bacteria in resting plaques dosed with DN were not significantly (P = 0.065) changed in comparison to those dosed with DA.
FIG 10
FIG 10
Distribution of pH measurements in plaques dosed with (DA) and without (DN) arginine dentifrice in the presence (C) and absence (R) of sucrose. Box plots: red, DN with sucrose; cyan, DA with sucrose; green, DN without sucrose; magenta, DA without sucrose. For details, see the legend to Fig. 1. pH was significantly (P < 0.001) higher in plaques during dosing with DA than in those dosed with DN in both resting and cariogenic plaques.
FIG 11
FIG 11
CDFF plaques analyzed by cluster analysis (a) and nonmetric MDS (b) in fermentors simulating cariogenic (square symbols) or resting (round symbols) plaques through the addition of sucrose (5% [wt/vol]) or water (dosed every 6 h), respectively. Dark and light blue symbols, respectively, indicate plaques during and after exposure to arginine dentifrice. Red and pink symbols, respectively, indicate plaques during and after exposure to nonarginine dentifrice. Black symbols indicate fermentors before dentifrice addition. Contour lines on the MDS plot superimpose 20% resemblance levels derived from the cluster analysis. Samples grouped significantly only based on sucrose addition (P < 0.006). Samples did not cluster significantly within runs based on exposure to arginine.

Similar articles

Cited by

References

    1. Bagramian RA, Garcia-Godoy F, Volpe AR. 2009. The global increase in dental caries. A pending public health crisis. Am J Dent 22:3–8. - PubMed
    1. Marsh PD. 1994. Microbial ecology of dental plaque and its significance in health and disease. Adv Dent Res 8:263–271. doi:10.1177/08959374940080022001. - DOI - PubMed
    1. Marsh PD. 2003. Plaque as a biofilm: pharmacological principles of drug delivery and action in the sub- and supragingival environment. Oral Dis 9:16–22. doi:10.1034/j.1601-0825.9.s1.4.x. - DOI - PubMed
    1. Marsh PD. 1991. Dentifrices containing new agents for the control of plaque and gingivitis: microbiological aspects. J Clin Periodontol 18:462–467. doi:10.1111/j.1600-051X.1991.tb02317.x. - DOI - PubMed
    1. Kleinberg I. 1967. Effect of urea concentration on human plaque pH levels in situ. Arch Oral Biol 12:1475–1484. doi:10.1016/0003-9969(67)90183-5. - DOI - PubMed

LinkOut - more resources