. 2018 Mar;13(1):64-76.
doi: 10.1007/s11481-017-9761-6. Epub 2017 Aug 31.

Differential Effects of Antiretroviral Drugs on Neurons In Vitro: Roles for Oxidative Stress and Integrated Stress Response

Affiliations

Differential Effects of Antiretroviral Drugs on Neurons In Vitro: Roles for Oxidative Stress and Integrated Stress Response

Anna L Stern et al. J Neuroimmune Pharmacol. 2018 Mar.

Abstract

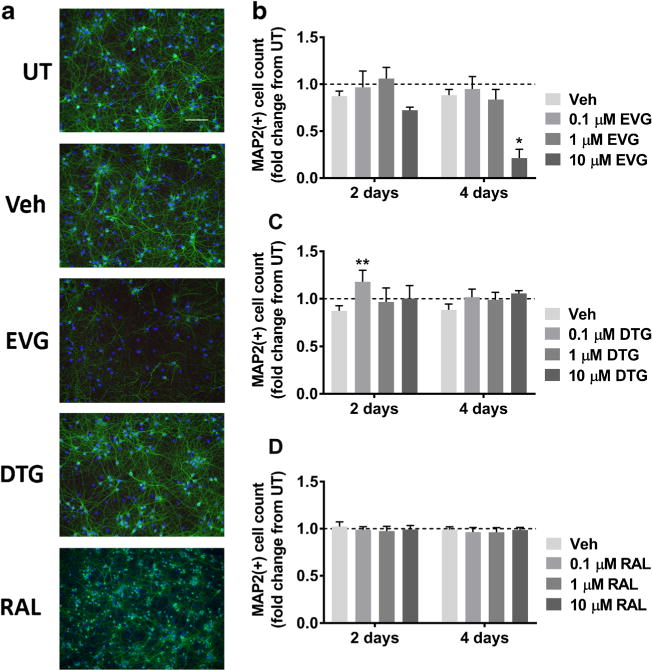
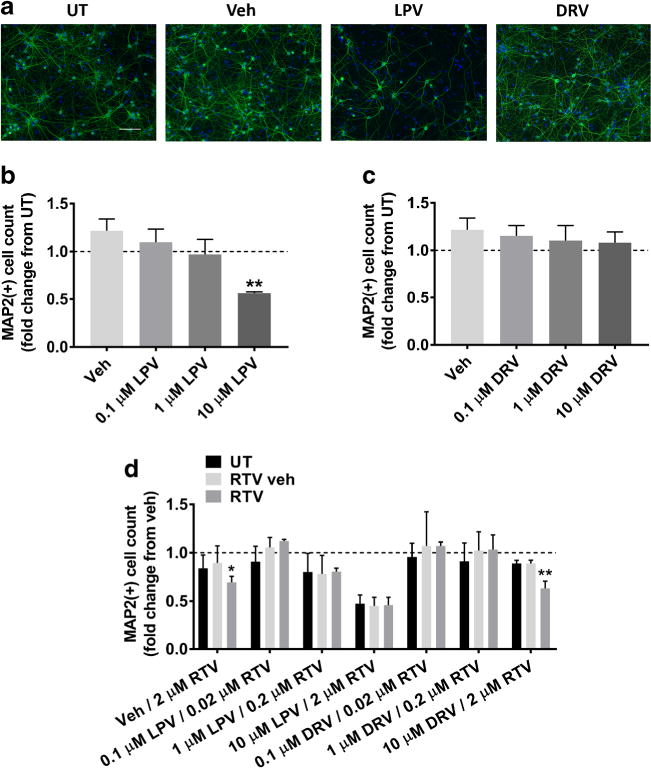
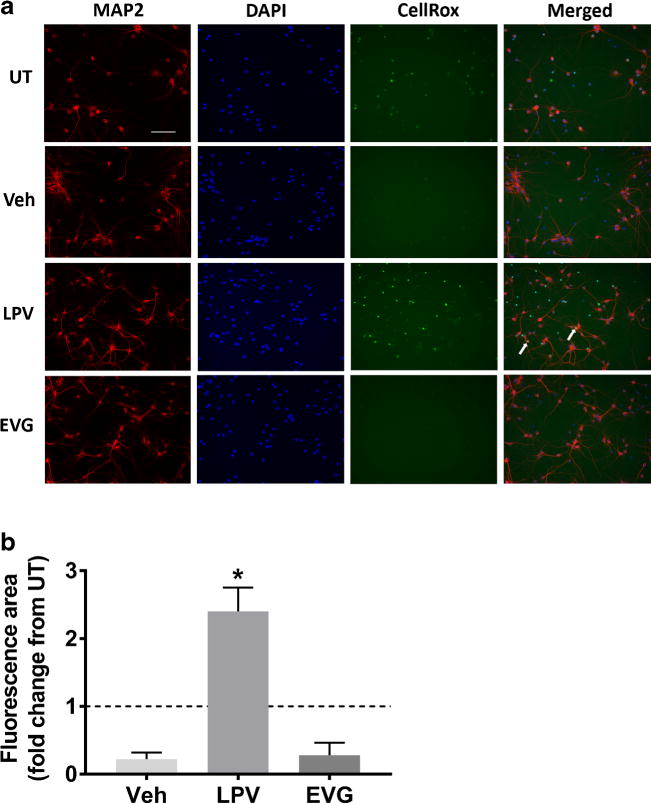
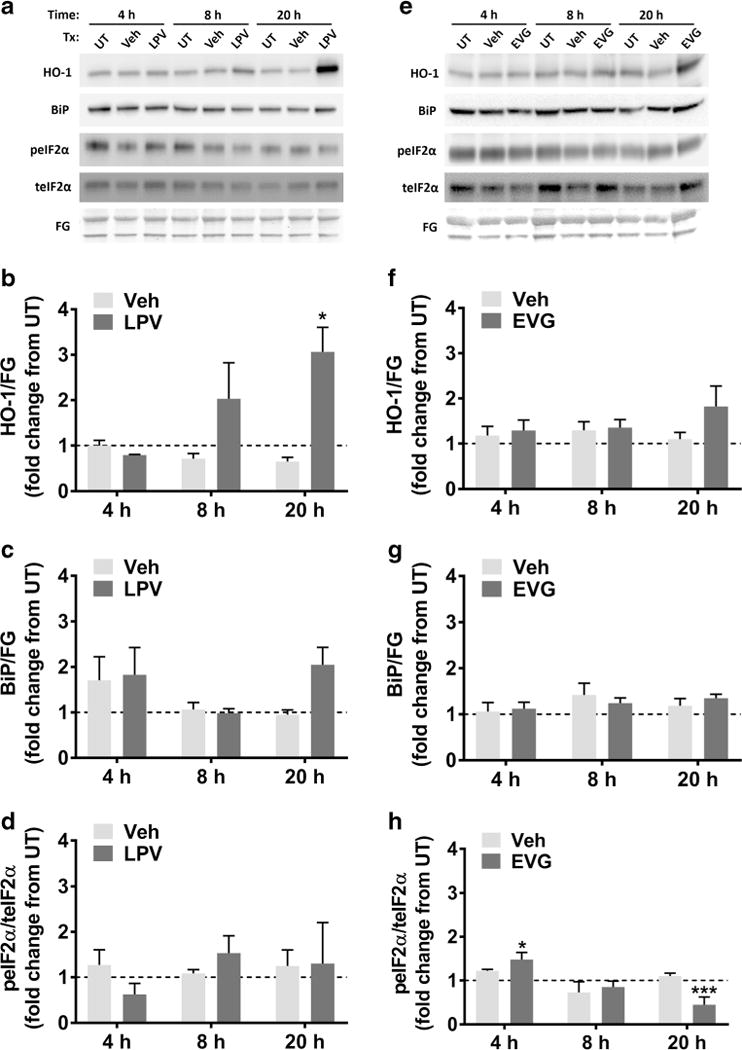
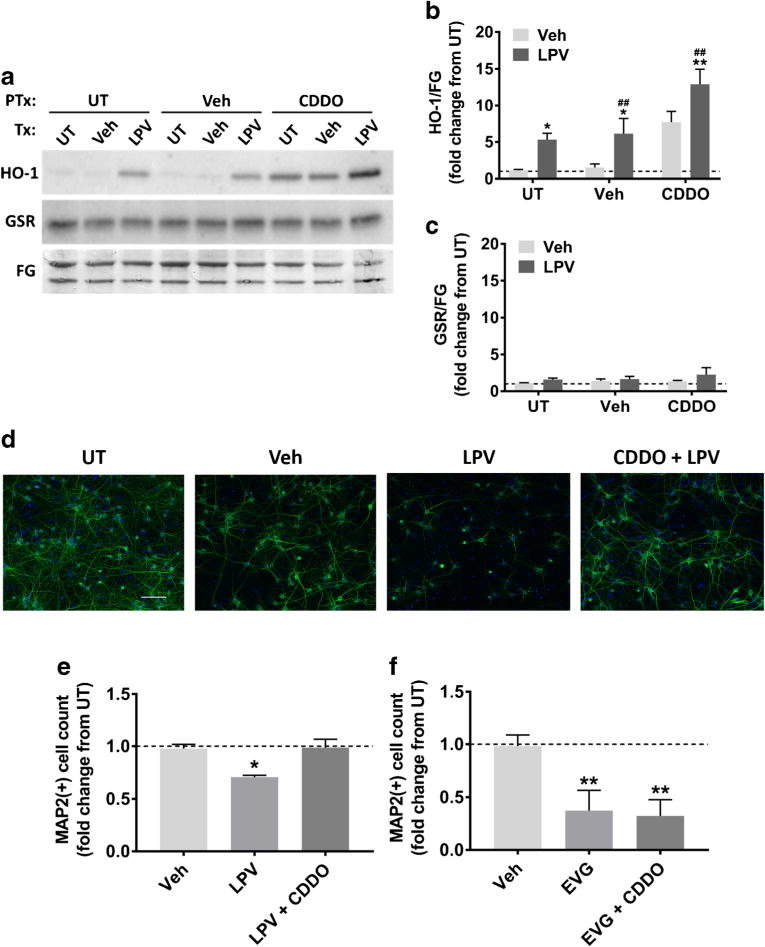
Mounting evidence suggests that antiretroviral drugs may contribute to the persistence of HIV-associated neurocognitive disorders (HAND), which impact 30%-50% of HIV-infected patients in the post-antiretroviral era. We previously reported that two first generation HIV protease inhibitors, ritonavir and saquinavir, induced oxidative stress, with subsequent neuronal death in vitro, which was reversed by augmentation of the endogenous antioxidant response by monomethyl fumarate. We herein determined whether two newer-generation PIs, darunavir and lopinavir, were deleterious to neurons in vitro. Further, we expanded our assessment to include three integrase strand transfer inhibitors, raltegravir, dolutegravir, and elvitegravir. We found that only lopinavir and elvitegravir were neurotoxic to primary rat neuroglial cultures as determined by the loss of microtubule-associated protein 2 (MAP2). Intriguingly, lopinavir but not elvitegravir led to oxidative stress and induced the endogenous antioxidant response (EAR). Furthermore, neurotoxicity of lopinavir was blocked by pharmacological augmentation of the endogenous antioxidant heme oxygenase-1 (HO-1), expanding our previous finding that protease inhibitor-induced neurotoxicity was mediated by oxidative stress. Conversely, elvitegravir but not lopinavir led to increased eIF2α phosphorylation, indicating the activation of a common adaptive pathway termed the integrated stress response (ISR), and elvitegravir-mediated neurotoxicity was partially alleviated by the ISR inhibitor trans-ISRIB, suggesting ISR as a promoter of elvitegravir-associated neurotoxicity. Overall, we found that neurotoxicity was induced only by a subset of protease inhibitors and integrase strand transfer inhibitors, providing evidence for class- and drug-specific neurotoxic effects of antiretroviral drugs. Future in vivo studies will be critical to confirm the neurotoxicity profiles of these drugs for incorporation of these findings into patient management. The EAR and ISR pathways are potential access points for the development of adjunctive therapies to complement antiretroviral therapies and limit their contribution to HAND persistence.

Keywords: Antiretroviral therapy; HIV; HIV-associated neurocognitive disorders; Heme oxygenase-1; Integrated stress response; Oxidative stress.


Figures

Fig. 1
Fig. 1
EVG but not DTG or RAL is toxic to primary rat cortical neuroglial cultures. a Cultures were treated with DMSO vehicle or 0.1 μM, 1 μM, or 10 μM EVG, DTG, or RAL for either 2 days or every other day for 4 days. Representative images of neuroglial cultures immunostained for MAP2 (green) and DAPI (blue) after treatment with 10 μM of indicated compounds for 4 days are shown at 20× magnification. Scale bar represents 100 μM. b-d Quantification of MAP2+ cells treated with indicated compounds is shown (repeated measures two-way ANOVA followed by Dunnett’s test, n = 3, *p < 0.05, **p < 0.01 vs drug vehicle). Dashed lines represent untreated (UT) cultures
Fig. 2
Fig. 2
LPV but not DRV is toxic to primary rat cortical neuroglial cultures. a Cultures were treated with DMSO vehicle or 0.1 μM, 1 μM, or 10 μM LPV or DRV for 2 days. Representative images of neuroglial cultures immunostained for MAP2 (green) and DAPI (blue) after treatment with 10 μM of the indicated compounds are shown at 20× magnification. Scale bar represents 100 μM. bc Quantification of MAP2+ cells treated with indicated compounds is shown (repeated measures one-way ANOVA followed by Dunnett’s test, n = 3, **p < 0.01 vs drug vehicle). Dashed lines represent untreated (UT) cultures. d Neurons were treated with LPV and DRV with or without simultaneous RTV or RTV vehicle treatment. RTV booster concentrations were given in fixed ratios with LPV and DRV concentrations. Quantification of MAP2+ cells treated with indicated compounds is shown (repeated measures two-way ANOVA followed by Dunnett’s test, n = 3, *p < 0.05, **p < 0.01 vs drug vehicle). Dashed line represents untreated (UT) cultures
Fig. 3
Fig. 3
LPV but not EVG induces oxidative stress. a Rat cortical neuroglial cultures were treated with DMSO vehicle or 10 μM LPV or EVG for 1 h prior to the addition of CellRox Green reagent and live cell imaging. Images captured by time-lapse live imaging were merged with the images of the same cells that were subsequently fixed and immunostained for MAP2 and DAPI. Representative images captured 30 min following CellRox addition show cells immunostained for MAP2 (red), DAPI (blue), and CellRox green at 20× magnification. Scale bar represents 100 μm; white arrows indicate examples of neurons that accumulated CellRox green dye. b Quantification of the area positive for CellRox green fluorescence normalized to untreated (UT) cultures (dashed line) is shown (repeated measures one-way ANOVA followed by Dunnett’s test, n = 4, *p < 0.05 vs drug vehicle)
Fig. 4
Fig. 4
LPV but not EVG induces the endogenous antioxidant response, while EVG but not LPV transiently increases the ratio of peIF2α/teIF2α. a Rat cortical neuroglial cultures were treated with DMSO vehicle or 10 μM LPV for 4, 8, or 20 h. Representative blots are shown. FG, fast green loading control. bd Band intensities of HO-1, BiP, peIF2α, and teIF2α were quantified using ImageJ software. HO-1 and BiP are normalized to FG, and peIF2α is normalized to teIF2α (repeated measures two-way ANOVA followed by Dunnett’s test, n = 3, *p < 0.05 vs drug vehicle). Dashed lines represent untreated (UT) cultures. e Rat cortical neuroglial cultures were treated with DMSO vehicle or 10 μM EVG for 4, 8, or 20 h. Representative immunoblots are shown. FG, fast green loading control. fh Band intensities of HO-1, BiP, peIF2α, and teIF2α were quantified using ImageJ software. HO-1 and BiP are normalized to FG, and peIF2α is normalized to teIF2α (repeated measures two-way ANOVA followed by Dunnett’s test, n = 3, *p < 0.05, ***p < 0.001 vs drug vehicle). Dashed lines represent untreated (UT) cultures
Fig. 5
Fig. 5
Pharmacological induction of HO-1 is protective against LPV-induced neurotoxicity. a Rat cortical neuroglial cultures were pretreated with either DMSO vehicle or 0.1 μM CDDO for 1 h prior to 20 h treatment with DMSO vehicle or 10 μM LPV. Representative immunoblots are shown. GSR, glutathione reductase; FG, fast green loading control. bc HO-1 and GSR band intensities were quantified using ImageJ software (repeated measures two-way ANOVA followed by Dunnett’s test, n = 3, *p < 0.05, **p < 0.01 vs drug vehicle, ##p < 0.01 vs CDDO vehicle). d Cultures were pretreated with either DMSO vehicle or 0.1 μM CDDO for 1 h prior to 48 h treatment with DMSO vehicle or 10 μM LPV. Representative images of LPV-treated cells immunostained for MAP2 (green) and DAPI (blue) are shown at 20× magnification. Scale bar represents 100 μM. e Quantification of MAP2+ cells treated with indicated compounds is shown (repeated measures one-way ANOVA followed by Dunnett’s test, n = 3, *p < 0.05 vs drug vehicle). f Cultures were pretreated with DMSO vehicle or 0.1 μM CDDO for 1 h prior to 10 μM EVG treatment. After 48 h, cells were retreated with DMSO vehicle or 10 μM EVG for another 48 h, followed by immunostaining. Quantification of MAP2+ cells treated with indicated compounds is shown (repeated measures one-way ANOVA followed by Dunnett’s test, n = 3, **p < 0.01 vs drug vehicle)
Fig. 6
Fig. 6
Pharmacological inhibition of peIF2α is partially protective against EVG-induced neurotoxicity. a Rat cortical neuroglial cultures were pretreated with DMSO vehicle or 5 μM trans-ISRIB for 1 h before treatment with 10 μM EVG for 4 h. Blots from two biological replicates are shown. FG, fast green loading control. b Rat cortical neuroglial cultures were pretreated with either DMSO vehicle or 5 μM trans-ISRIB for 1 h prior to treatment with 10 μM EVG every other day for 4 days. Representative images of neuroglial cultures immunostained for MAP2 (green) and DAPI (blue) after treatment with the indicated compounds for 4 days are shown at 20× magnification. Scale bar represents 100 μM. c Quantification of MAP2+ cells treated with indicated compounds is shown (repeated measures two-way ANOVA followed by Dunnett’s test, n = 3, *p < 0.05 vs drug vehicle, #p < 0.05 vs ISRIB vehicle). Dashed lines represent untreated (UT) cultures

References

    1. Akay C, Lindl KA, Wang Y, White MG, Isaacman-Beck J, Kolson DL, Jordan-Sciutto KL. Site-specific hyperphosphorylation of pRb in HIV-induced neurotoxicity. Mol Cell Neurosci. 2011;47:154–165. - PMC - PubMed
    1. Akay C, Lindl KA, Shyam N, Nabet B, Goenaga-Vazquez Y, Ruzbarsky J, Wang Y, Kolson DL, Jordan-Sciutto KL. Activation status of integrated stress response pathways in neurones and astrocytes of HIV-associated neurocognitive disorders (HAND) cortex. Neuropathol Appl Neurobiol. 2012;38:175–200. - PMC - PubMed
    1. Akay C, Cooper M, Odeleye A, Jensen BK, White MG, Vassoler F, Gannon PJ, et al. Antiretroviral drugs induce oxidative stress and neuronal damage in the central nervous system. J Neuro-Oncol. 2014;20:39–53. - PMC - PubMed
    1. Anthonypillai C, Sanderson RN, Gibbs JE, Thomas SA. The distribution of the HIV protease inhibitor, ritonavir, to the brain, cerebrospinal fluid, and choroid plexuses of the Guinea pig. J Pharmacol Exp Ther. 2004;308:912–920. - PubMed
    1. Baburamani AA, Ek CJ, Walker DW, Castillo-Melendez M. Vulnerability of the developing brain to hypoxic-ischemic damage: contribution of the cerebral vasculature to injury and repair? Front Physiol. 2012;3:424. - PMC - PubMed

Publication types

Substances

LinkOut - more resources