

The Functional Response of Mesenchymal Stem Cells to Electron-Beam Patterned Elastomeric Surfaces Presenting Micrometer to Nanoscale Heterogeneous Rigidity
- PMID: 28861921
- PMCID: PMC7391933
- DOI: 10.1002/adma.201702119
The Functional Response of Mesenchymal Stem Cells to Electron-Beam Patterned Elastomeric Surfaces Presenting Micrometer to Nanoscale Heterogeneous Rigidity
Abstract
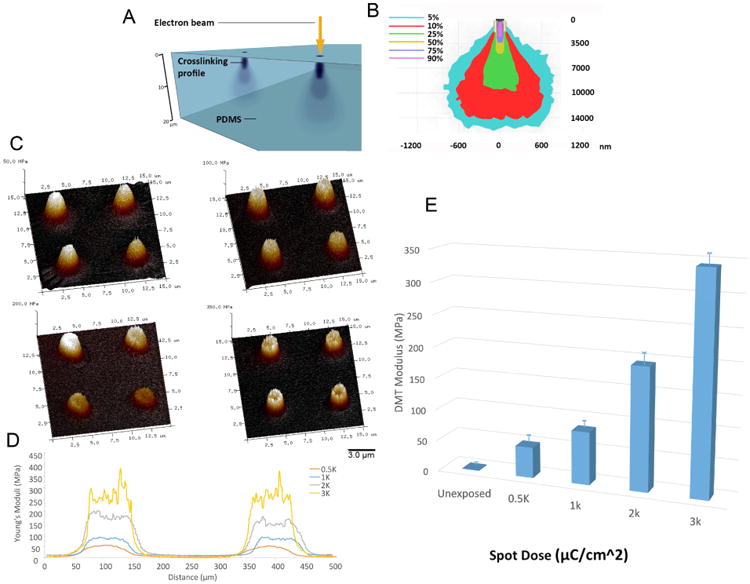
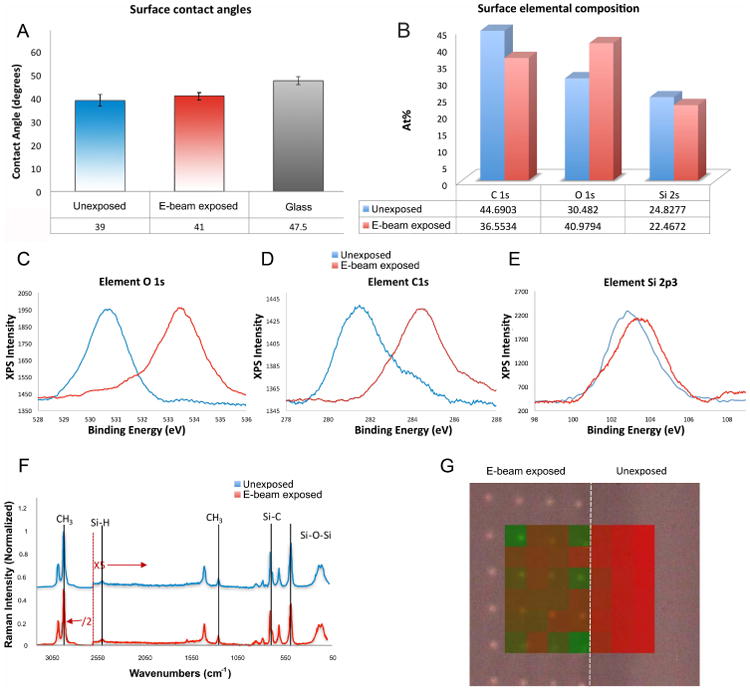
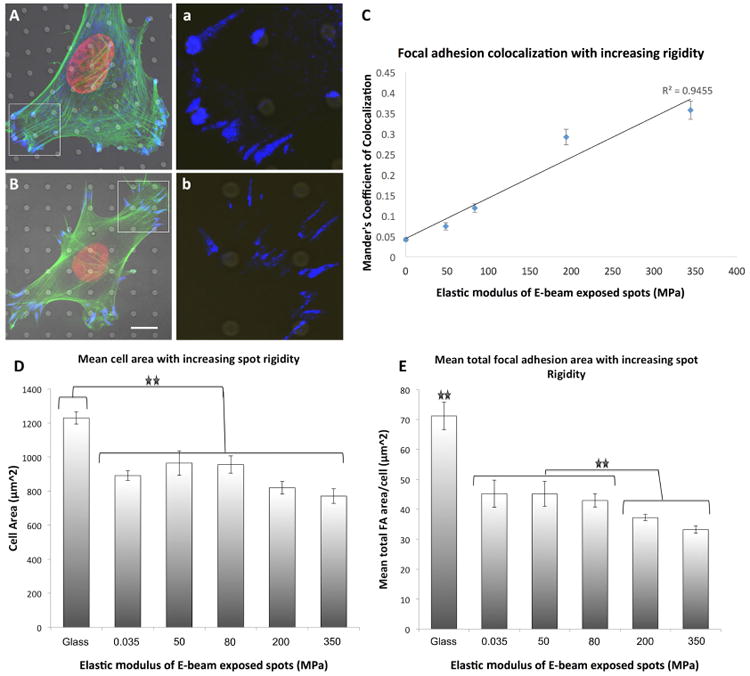
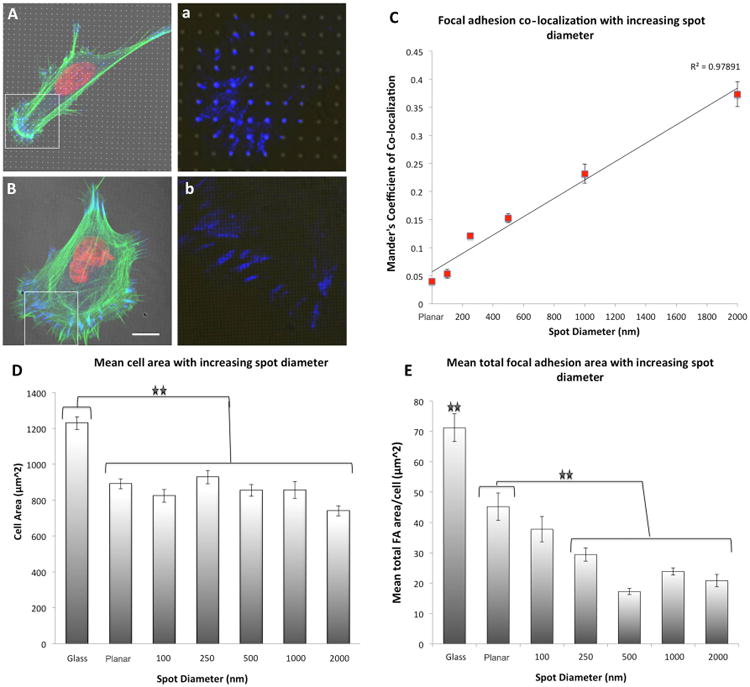
Cells directly probe and respond to the physicomechanical properties of their extracellular environment, a dynamic process which has been shown to play a key role in regulating both cellular adhesive processes and differential cellular function. Recent studies indicate that stem cells show lineage-specific differentiation when cultured on substrates approximating the stiffness profiles of specific tissues. Although tissues are associated with a range of Young's modulus values for bulk rigidity, at the subcellular level, tissues are comprised of heterogeneous distributions of rigidity. Lithographic processes have been widely explored in cell biology for the generation of analytical substrates to probe cellular physicomechanical responses. In this work, it is shown for the first time that that direct-write e-beam exposure can significantly alter the rigidity of elastomeric poly(dimethylsiloxane) substrates and a new class of 2D elastomeric substrates with controlled patterned rigidity ranging from the micrometer to the nanoscale is described. The mechanoresponse of human mesenchymal stem cells to e-beam patterned substrates was subsequently probed in vitro and significant modulation of focal adhesion formation and osteochondral lineage commitment was observed as a function of both feature diameter and rigidity, establishing the groundwork for a new generation of biomimetic material interfaces.
Keywords: electron beam; focal adhesions; mechanotransduction; polydimethylsiloxane; rigidity; stem cells.
© 2017 WILEY-VCH Verlag GmbH & Co. KGaA, Weinheim.
Figures
Similar articles
-
Assaying stem cell mechanobiology on microfabricated elastomeric substrates with geometrically modulated rigidity.Nat Protoc. 2011 Feb;6(2):187-213. doi: 10.1038/nprot.2010.189. Epub 2011 Jan 27. Nat Protoc. 2011. PMID: 21293460 Free PMC article.
-
Mechanical regulation of cell function with geometrically modulated elastomeric substrates.Nat Methods. 2010 Sep;7(9):733-6. doi: 10.1038/nmeth.1487. Epub 2010 Aug 1. Nat Methods. 2010. PMID: 20676108 Free PMC article.
-
Quasi-3D morphology and modulation of focal adhesions of human adult stem cells through combinatorial concave elastomeric surfaces with varied stiffness.Soft Matter. 2019 Jun 26;15(25):5154-5162. doi: 10.1039/c9sm00481e. Soft Matter. 2019. PMID: 31192342
-
Effect of Polymeric Matrix Stiffness on Osteogenic Differentiation of Mesenchymal Stem/Progenitor Cells: Concise Review.Polymers (Basel). 2021 Aug 31;13(17):2950. doi: 10.3390/polym13172950. Polymers (Basel). 2021. PMID: 34502988 Free PMC article. Review.
-
Mechanically induced osteogenic lineage commitment of stem cells.Stem Cell Res Ther. 2013;4(5):107. doi: 10.1186/scrt318. Stem Cell Res Ther. 2013. PMID: 24004875 Free PMC article. Review.
Cited by
-
Cells on Hydrogels with Micron-Scaled Stiffness Patterns Demonstrate Local Stiffness Sensing.Nanomaterials (Basel). 2022 Feb 15;12(4):648. doi: 10.3390/nano12040648. Nanomaterials (Basel). 2022. PMID: 35214978 Free PMC article.
-
Boron Nitride Nanotube Addition Enhances the Crystallinity and Cytocompatibility of PVDF-TrFE.Front Chem. 2019 May 21;7:364. doi: 10.3389/fchem.2019.00364. eCollection 2019. Front Chem. 2019. PMID: 31165067 Free PMC article.
-
Bio-instructive materials for musculoskeletal regeneration.Acta Biomater. 2019 Sep 15;96:20-34. doi: 10.1016/j.actbio.2019.07.014. Epub 2019 Jul 11. Acta Biomater. 2019. PMID: 31302298 Free PMC article. Review.
-
Modulated nanowire scaffold for highly efficient differentiation of mesenchymal stem cells.J Nanobiotechnology. 2022 Jun 16;20(1):282. doi: 10.1186/s12951-022-01488-5. J Nanobiotechnology. 2022. PMID: 35710420 Free PMC article.
-
Electron beam lithography for direct patterning of MoS2 on PDMS substrates.RSC Adv. 2021 Jun 9;11(32):19908-19913. doi: 10.1039/d1ra00885d. eCollection 2021 May 27. RSC Adv. 2021. PMID: 35479206 Free PMC article.
References
MeSH terms
Substances
Grants and funding
LinkOut - more resources
Full Text Sources
Other Literature Sources
