. 2017 Oct;27(10):1258-1274.
doi: 10.1038/cr.2017.112. Epub 2017 Sep 1.

Genome-wide identification of histone H2A and histone variant H2A.Z-interacting proteins by bPPI-seq

Affiliations

Genome-wide identification of histone H2A and histone variant H2A.Z-interacting proteins by bPPI-seq

Yi Zhang et al. Cell Res. 2017 Oct.

Abstract

H2A is a nucleosome core subunit involved in organizing DNA into a chromatin structure that is often inaccessible to regulatory enzymes. Replacement of H2A by its variant H2A.Z renders chromatin accessible at enhancers and promoters. However, it remains unclear how H2A.Z functions so differently from canonical H2A. Here we report the genome-wide identification of proteins that directly interact with H2A and H2A.Z in vivo using a novel strategy, bPPI-seq. We show that bPPI-seq is a sensitive and robust technique to identify protein-protein interactions in vivo. Our data indicate that H2A.Z-interacting proteins and H2A-interacting proteins participate in distinct biological processes. In contrast to H2A-interacting proteins, the H2A.Z-interacting proteins are involved in transcriptional regulation. We found that the transcription factor Osr1 interacts with H2A.Z both in vitro and in vivo. It also mediates H2A.Z incorporation to a large number of target sites and regulates gene expression. Our data indicate that bPPI-seq can be widely applied to identify genome-wide interacting proteins under physiological conditions.


Figures

Figure 1
Figure 1
Genome-wide detection of H2A- and H2A.Z-interacting proteins using bPPI-seq. (A) Co-expression of GFPN-H2A.Z with ANP32E-GFPC reconstitutes an active green fluorescent protein. The constructs expressing full-length fusion proteins in pEF1a vector were co-transfected into NIH 3T3 cells and examined under microscope 48 h post transfection. Tinf2-GFPC is used as a negative control. (B) Isolation of GFP+ cells by flow cytometry sorting. The stable cell lines expressing GFPN-H2A.Z, GFPN-H2A or GFPN alone were transduced with three ReMTH-GFPC1, 2 and 3 viral particles to tag endogenous genes with GFPC domain, selected by puromycin for 5 days, followed by Doxycycline induction for 48 h before sorting. (C) Flow chart for preparation of the H2A.Z-interacting protein libraries (bPPI-seq) from RNAs isolated from the sorted cells. (D) Genome Browser image showing the bPPI-seq reads in the gene encoding H2A.Z-interacting protein ANP32E. The y-axis was normalized to library sequencing depth. The peak location indicates the fusion site of hybrid mRNA between C-terminal half (GFPC) and the mRNA of endogenous gene. The panels from top to the bottom are bPPI-seq GFPN (two replicates), bPPI-seq GFPN-H2A (two replicates), bPPI-seq GFPN-H2A.Z (two replicates) and RNA-seq.
Figure 2
Figure 2
GFPN-H2A.Z is incorporated into chromatin with enrichment in transcriptional regulatory regions similar to endogenous H2A.Z. (A) A snapshot of genome browser image of ChIP-seq data for endogenous H2A.Z and GFPN-H2A.Z-HA. The top panel corresponds to H2A.Z ChIP-seq in shLuc control cells. The bottom panel corresponds to HA CHIP-seq in the GFPN-H2A.Z-HA stable cell line. (B) Venn diagram showing that H2A.Z- and GFPN-H2A.Z-HA-enriched regions highly overlap. (C) Average TSS profile plots for the tag density of the H2A.Z ChIP-seq in control cells and HA ChIP-seq in the GFPN-H2A.Z-HA stable cell line. (D) TSS profile plots for the logarithm of the density of the H2A.Z and GFPN-H2A.Z-HA ChIP-seq experiments.
Figure 3
Figure 3
H2A- and H2A.Z-interacting proteins are enriched in distinctive biological processes. (A) Venn diagram showing that H2A and H2A.Z interact with different sets of proteins. (B) Detection of H2A- and H2A.Z-interacting proteins by bPPI-seq is highly reproducible between replicate experiments. The log2 rpkm values of mRNAs of interacting proteins between replicate experiments are compared in scatter plots. (C) A heat map showing the significance of the gene ontology (GO) terms for the H2A.Z-interacting proteins and H2A-interacting proteins. H2A-interacting proteins and H2A.Z-interacting proteins are involved in distinct biological processes. Highlighted terms are transcription-related terms based on the definitions of GO terms. The color level represents the negative logarithm of the adjusted P-value for the significance of the GO terms. The intensity of red represents greater significance of the GO terms whereas blue represents less significant GO terms. A cutoff of color level = 4.3 (corresponding to a P-value of 0.05) is applied to consider if the GO terms are statistically significant for the gene sets.
Figure 4
Figure 4
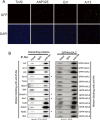
Validation of the H2A.Z-interacting proteins. (A) Reconstitution of active GFPs by co-expression of the fusion proteins GFPC-H2A.Z interactor and GFPN-HA-H2A.Z. The construct expressing the fusion protein between GFPC and an H2A.Z-interacting protein was transfected into the stable cell line expressing GFPN-HA-H2A.Z fusion protein and induced using Doxycyline for 48 h. Images of GFP and DAPI staining signals were taken (10×). (B) Co-IP of GFPN-HA-H2A.Z with the fusion protein between GFPC and H2A.Z-interacting proteins. Whole-cell extracts were made from the cells expressing the GFPN-HA-H2A.Z and its interacting fusion proteins as described in (A) and immunoprecipitated using HA antibody. The immunoprecipitates were resolved by SDS-PAGE and blotted by anti-FLAG antibody that detects the H2A.Z interactor fusion protein (left panel) and HA antibody that detects the GFPN-HA-H2A.Z fusion protein (right panel), respectively. The asterisks indicate cytoplasmic proteins based on literature.
Figure 5
Figure 5
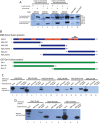
Osr1 interacts directly with H2A.Z in vivo and in vitro. (A) Osr1 co-immunoprecipitates with H2A.Z but not H2A from cell extracts. Whole-cell extracts were prepared from NIH3T3 cells co-transfected with Osr1-FLAG-GFPC or Tinf2-FLAG-GFPC and GFPN-HA-H2A or GFPN-HA-H2A.Z for 48 h, followed by immunoprecipitation using anti-FLAG or anti-HA antibodies. The immunoprecipitates were washed with buffers containing 300 or 500 mM NaCl and detected by western blotting with anti-HA antibody. (B) Cartoons showing the full length and truncated H2A.Z proteins expressed in bacteria as MBP fusion proteins, which were purified using Amylose beads. The helices and M6 acid patch domains are indicated. The full length and different truncated Osr1 proteins were expressed in bacteria as GST fusion proteins and purified using glutathione-Sepharose 4B beads. (C) GST or GST-Osr1 fusion proteins bound to beads were incubated with different MBP-H2A.Z fusion proteins. The H2A.Z proteins captured by the beads were detected by western blotting using anti-HA antibody. (D) MBP or MBP-H2A.Z fusion proteins bound to beads were incubated with different GST-Osr1 fusion proteins. The Osr1 proteins captured by the beads were detected by western blotting using anti-FLAG antibody.
Figure 6
Figure 6
Osr1 facilitates H2A.Z targeting and co-regulates gene expression with H2A.Z. (A) Genome browser image showing the co-localization of H2A.Z and Osr1 ChIP-Seq signals on chromatin. (B) Venn diagram showing the overlap of Osr1 and H2A.Z peaks in the genome. The number in red (blue) in the intersection region refers to the number of Osr1 (H2A.Z) peaks overlapping with H2A.Z (Osr1) peaks. The difference between the number of overlapping peaks is due to the overlap between multiple Osr1 peaks and a single H2A.Z peak. The P-value for the significance of overlap was calculated by using the hypergeometric distribution, in which the smaller number of overlapped peaks was used. (C) The changes in gene expression by knocking down H2A.Z and Osr1 are highly correlated. The gene expression in shLuc, shH2A.Z and shOsr1 cells was measured using RNA-seq. The fold change of gene expression (FC) was calculated for shH2A.Z and shOsr1 by comparing to shLuc. (D) Venn diagram showing the overlap of up-regulated genes after knocking down H2A.Z and Osr1. The P-values were calculated by using the hypergeometric distribution with 22 490 total genes. (E) Venn diagram showing the overlap of down-regulated genes after knocking down H2A.Z and Osr1. The P-value was calculated by using the hypergeometric distribution with 22 490 total genes.
Figure 7
Figure 7
Osr1 facilitates incorporation of H2A.Z to regions containing target motifs. (A) The Osr1 motif logo identified by SELEX using bacterially expressed GST-Osr1 protein and mouse genomic DNA. (B) Volcano plot of changes in H2A.Z ChIP-Seq peaks after knocking down Osr1. The blue and green circles indicate the H2A.Z peaks without and with an Osr1 motif, respectively. The vertical red lines indicate 1.5-fold change and horizontal red line indicates a significant P-value cutoff. (C) A significantly larger fraction of decreased H2A.Z peaks contain an Osr1 motif than the increased H2A.Z peaks. The fractions of the H2A.Z peaks containing Osr1 motif were calculated according to Supplementary information, Table S9. (D) Volcano plot of changes in H2A.Z ChIP-Seq peaks following knockdown of Osr1. The blue and green circles indicate the H2A.Z peaks without and with Osr1 binding, respectively. The vertical red lines indicate a two-fold change and horizontal red line indicates a significant P-value cutoff. (E) The observed relative frequency of decreased and increased H2A.Z peaks that have Osr1 binding. The frequency of the H2A.Z peaks that have Osr1 binding was calculated according to Supplementary information, Table S9.

Similar articles

Cited by

References

    1. Larochelle M, Gaudreau L. H2A.Z has a function reminiscent of an activator required for preferential binding to intergenic DNA. EMBO J 2003; 22:4512–4522. - PMC - PubMed
    1. Faast R, Thonglairoam V, Schulz TC, et al. Histone variant H2A.Z is required for early mammalian development. Curr Biol 2001; 11:1183–1187. - PubMed
    1. Clarkson MJ, Wells JR, Gibson F, Saint R, Tremethick DJ. Regions of variant histone His2AvD required for Drosophila development. Nature 1999; 399:694–697. - PubMed
    1. Barski A, Cuddapah S, Cui K, et al. High-resolution profiling of histone methylations in the human genome. Cell 2007; 129:823–837. - PubMed
    1. Zhang H, Roberts DN, Cairns BR. Genome-wide dynamics of Htz1, a histone H2A variant that poises repressed/basal promoters for activation through histone loss. Cell 2005; 123:219–231. - PMC - PubMed