. 2017 Sep 1:76:12.12.1-12.12.16.
doi: 10.1002/cpcb.28.

Automated Tracking of Cell Migration with Rapid Data Analysis

Affiliations

Automated Tracking of Cell Migration with Rapid Data Analysis

Brian J DuChez. Curr Protoc Cell Biol. .

Abstract

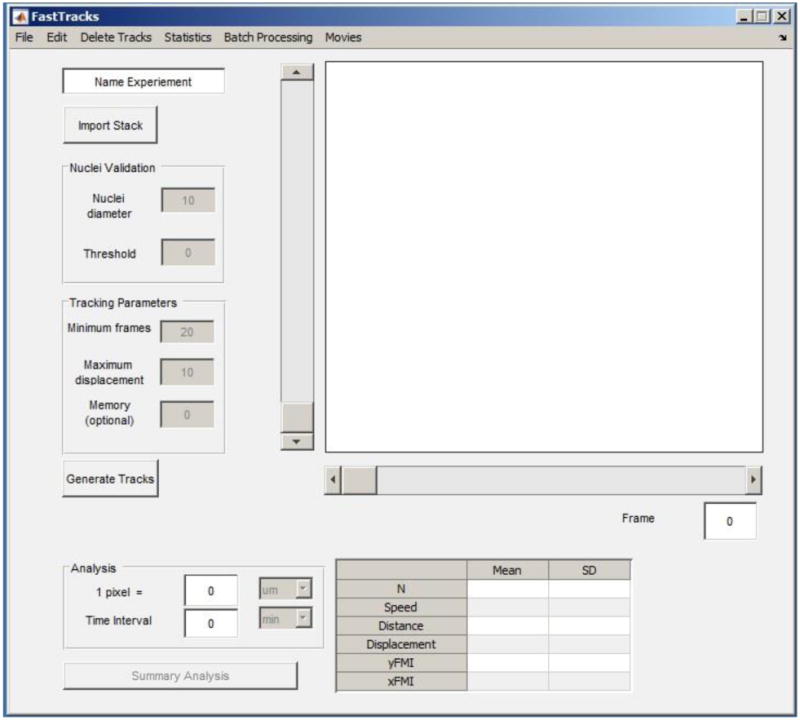
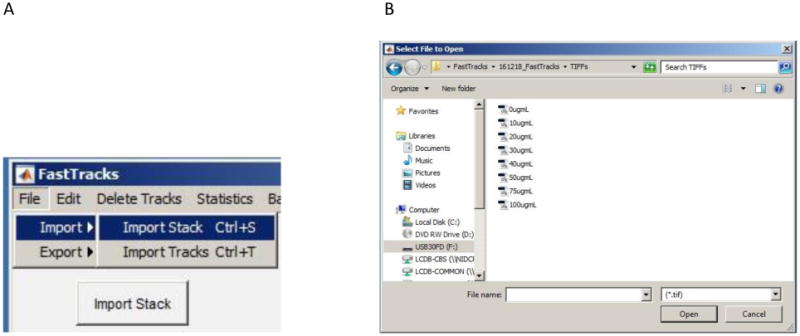
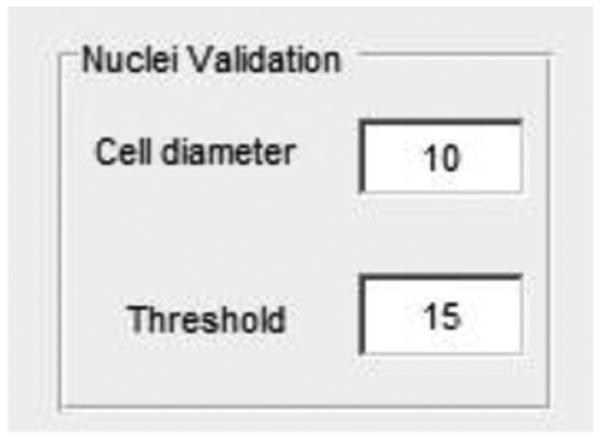
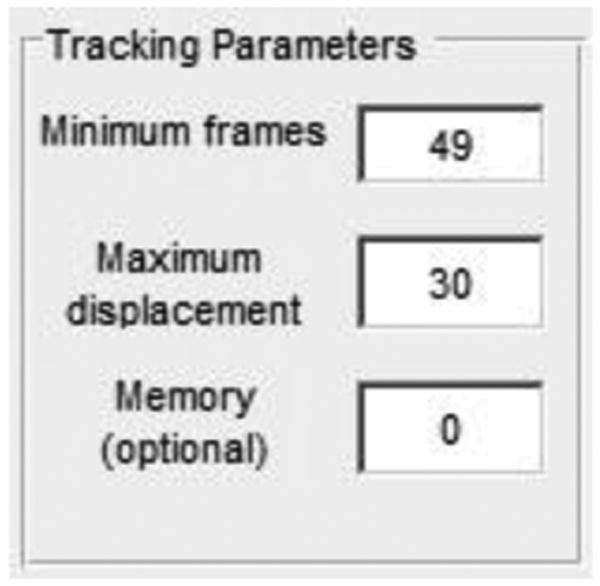
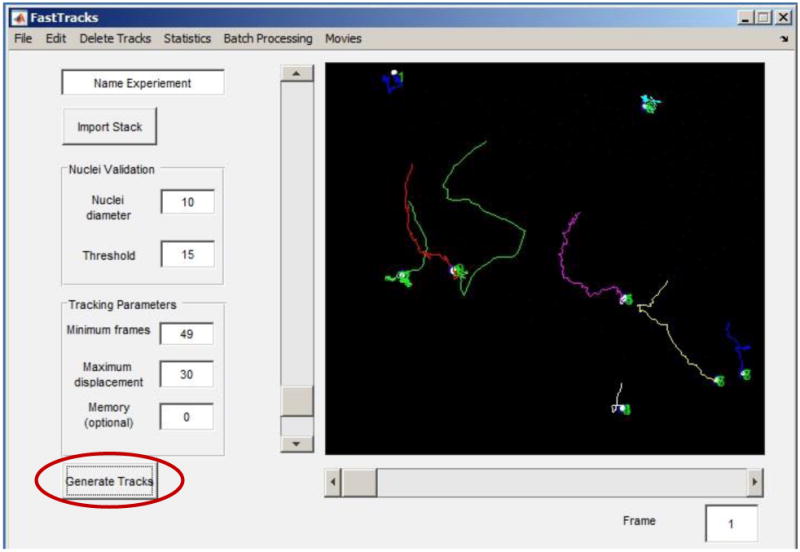
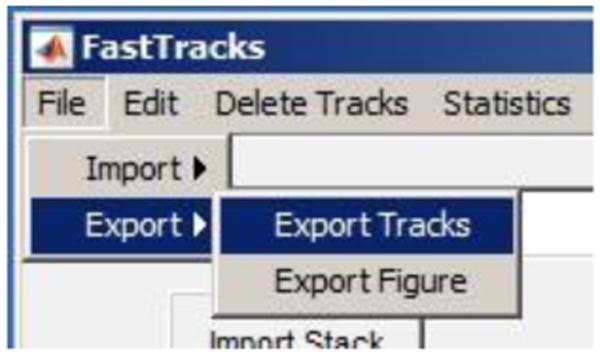
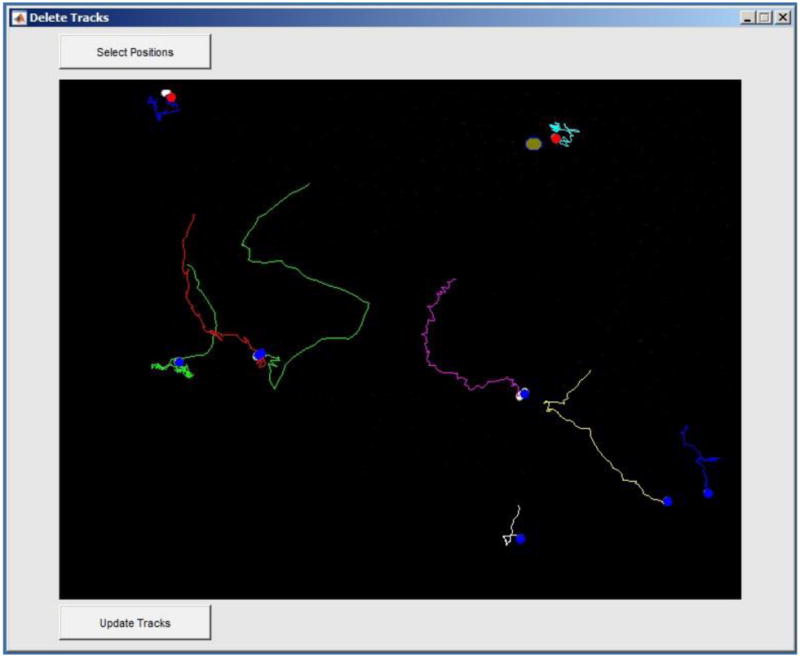
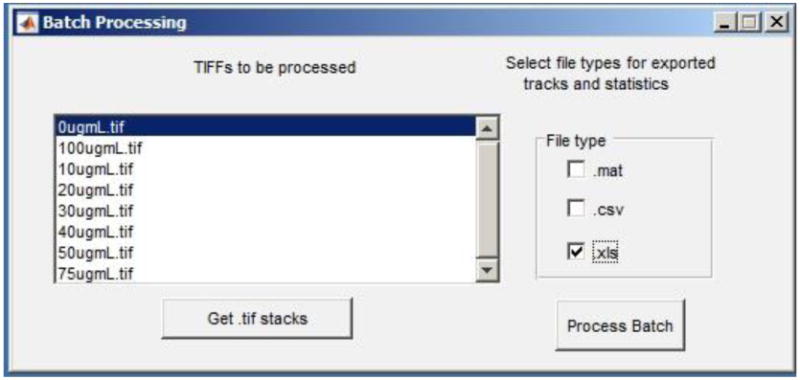
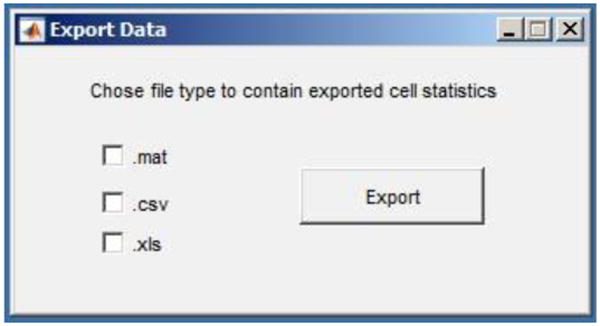
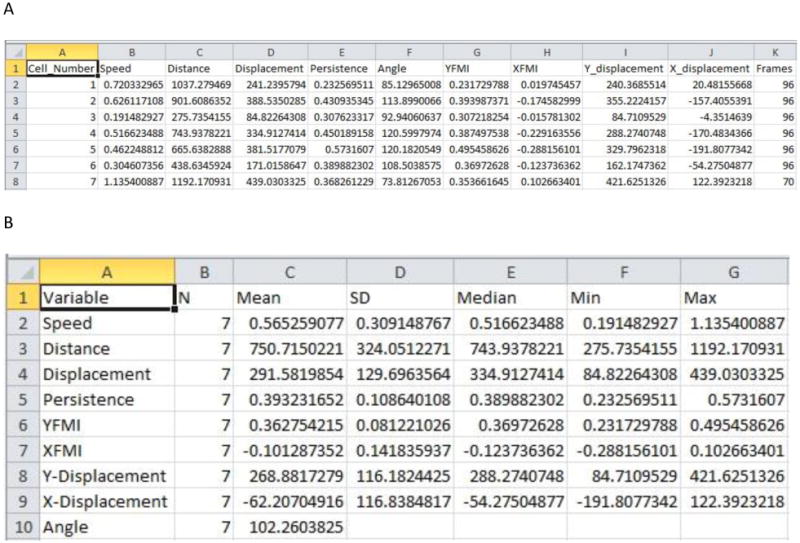
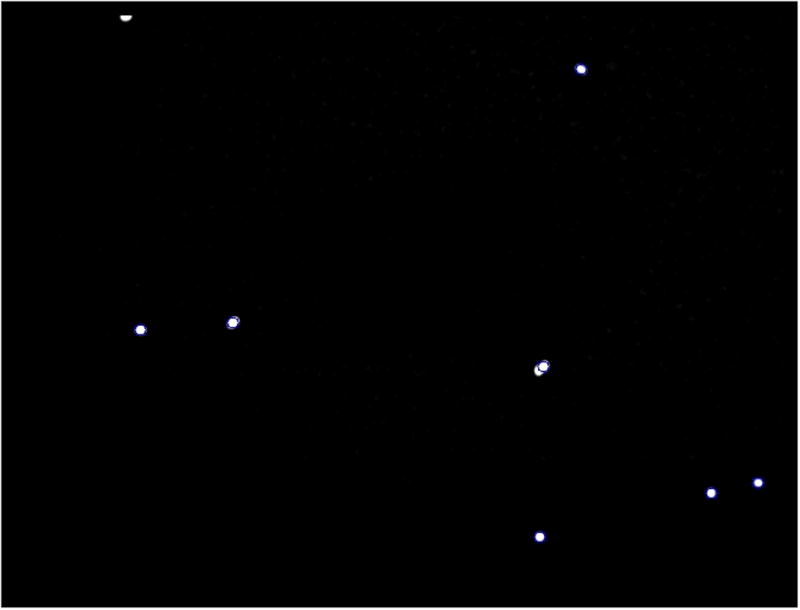
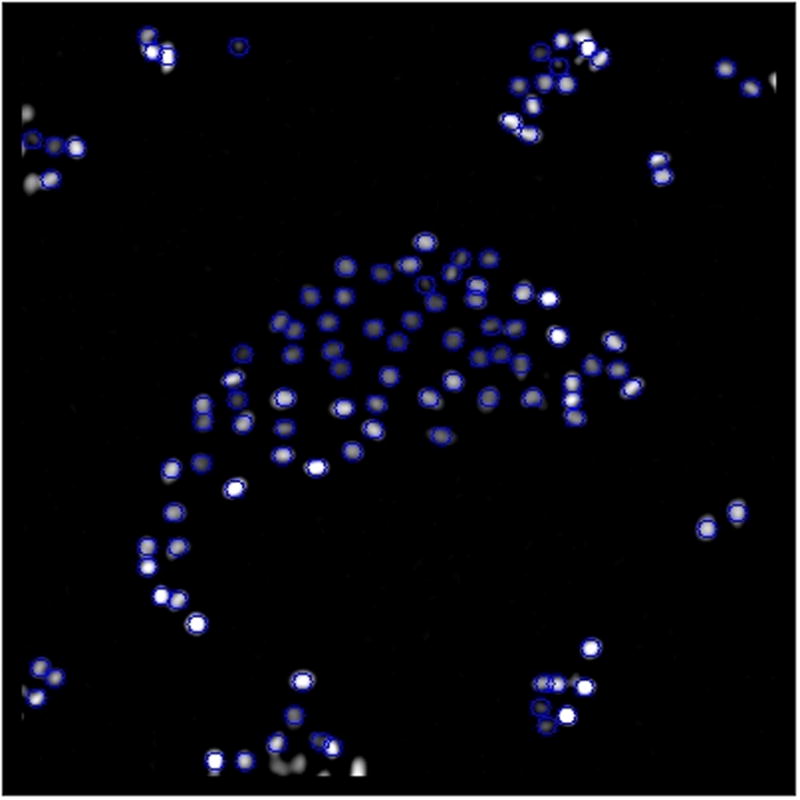
Cell migration is essential for many biological processes including development, wound healing, and metastasis. However, studying cell migration often requires the time-consuming and labor-intensive task of manually tracking cells. To accelerate the task of obtaining coordinate positions of migrating cells, we have developed a graphical user interface (GUI) capable of automating the tracking of fluorescently labeled nuclei. This GUI provides an intuitive user interface that makes automated tracking accessible to researchers with no image-processing experience or familiarity with particle-tracking approaches. Using this GUI, users can interactively determine a minimum of four parameters to identify fluorescently labeled cells and automate acquisition of cell trajectories. Additional features allow for batch processing of numerous time-lapse images, curation of unwanted tracks, and subsequent statistical analysis of tracked cells. Statistical outputs allow users to evaluate migratory phenotypes, including cell speed, distance, displacement, and persistence, as well as measures of directional movement, such as forward migration index (FMI) and angular displacement. © 2017 by John Wiley & Sons, Inc.

Keywords: automated tracking; cell migration; cell tracking; time-lapse imaging.


Figures

Figure 1
Figure 1
Screenshot of the FastTracks GUI immediately after initializing the program.
Figure 2
Figure 2
Screenshot showing where to enter the name of the experiment. This name will be appended to exported data generated in FastTracks.
Figure 3
Figure 3
Screenshot showing A) options for importing image stacks and B) the file selection window from which you navigate to image files of interest.
Figure 4
Figure 4
Screenshot showing where to enter the approximate diameter of the nuclei and threshold for the image being evaluated.
Figure 5
Figure 5
Screenshot showing where to enter Minimum frames, Maximum displacement, and Memory parameters.
Figure 6
Figure 6. Display of cell trajectories overlaid onto the current frame of the time-lapse stack after initiating the Generate Tracks function
Figure 7
Figure 7. Screenshot showing where to find the Export Tracks option
Figure 8
Figure 8
Example Delete Tracks window. Two tracks have been selected to be deleted from the tracks data set as indicated by the red circle that overlays the initial positions of these tracks.
Figure 9
Figure 9
The Batch Processing window features a list box that contains the file names of TIFF documents that will be analyzed. One or more file types containing data of interest can also be exported.
Figure 10
Figure 10. Screen shot showing where to find the ROI Blackout option
Figure 11
Figure 11
A) The preprocessed image reflects the raw image data that will be imported into the FastTracks program, which in this case contains fluorescent debris. B) Post-processing of the image by setting nuclei parameters may incorrectly identify portions of the debris for tracking. C) Applying the ROI Blackout feature eliminates this region from the image stack, thereby preventing erroneous tracks from being generated.
Figure 12
Figure 12. Screen shot of the Analysis panel on the main GUI window
Figure 13
Figure 13
Graphical schematic of a cell trajectory and variables used to report migratory phenotypes.
Figure 14
Figure 14. Screen shot of Export Data window
Figure 15
Figure 15
Examples of population and individual cell statistics data. A) The individual cell statistics data set contains a numerical identifier for each cell and includes the cells speed, distance, displacement, persistence, angular displacement, FMI along the X and Y axis, Y-displacement, X-displacement, and the number of frames the cell was tracked (see Figure 13 and Table I for how these values are calculated). B) Population statistics contain the mean, standard deviation, median, minimum and maximum values for the individual cell statistics data set.
Movie 1
Movie 1. Trajectories of a low-density culture
A movie of fluorescently labeled nuclei trajectories from a low density culture of U87 cells imaged for 24 h at 15 min intervals. The trajectories were generated using the following settings: Nuclei diameter = 12, Threshold = 15, Minumum frames = 49, Maximum displacement = 30. (Practice using FastTracks by importing the low_density_culture.tif contained in the downloadable sample_TIFFs folder.)
Movie 2
Movie 2. Trajectories of a high-density culture
A movie of fluorescently labeled nuclei trajectories from a high density culture of MDCK cells imaged for 4 h at 5 min intervals. The trajectories were generated using the following settings: Nuclei diameter = 10, Threshold = 10, Minumum frames = 20, Maximum displacement = 10. (Practice using FastTracks by importing the high_density_culture.tif contained in the downloadable FastTracks program files.)

References

    1. Cordelieres FP, Petit V, Kumasaka M, Debeir O, Letort V, Gallagher SJ, Larue L. Automated cell tracking and analysis in phase-contrast videos (iTrack4U): development of Java software based on combined mean-shift processes. PLoS One. 2013;8:e81266. - PMC - PubMed
    1. Crocker JC, Grier DG. Methods of digital video microscopy for colloidal studies. J Colloid Interf Sci. 1996;179:298–310.
    1. Friedl P, Alexander S. Cancer invasion and the microenvironment: plasticity and reciprocity. Cell. 2011;147:992–1009. - PubMed
    1. Hand AJ, Sun T, Barber DC, Hose DR, MacNeil S. Automated tracking of migrating cells in phase-contrast video microscopy sequences using image registration. J Microsc. 2009;234:62–79. - PubMed
    1. Manzo C, Garcia-Parajo MF. A review of progress in single particle tracking: from methods to biophysical insights. Rep Prog Phys. 2015;78 - PubMed

LinkOut - more resources