. 2017 Sep 1;12(9):e0182941.
doi: 10.1371/journal.pone.0182941. eCollection 2017.

A novel rapid and reproducible flow cytometric method for optimization of transfection efficiency in cells

Affiliations

A novel rapid and reproducible flow cytometric method for optimization of transfection efficiency in cells

Stefanie Homann et al. PLoS One. .

Abstract

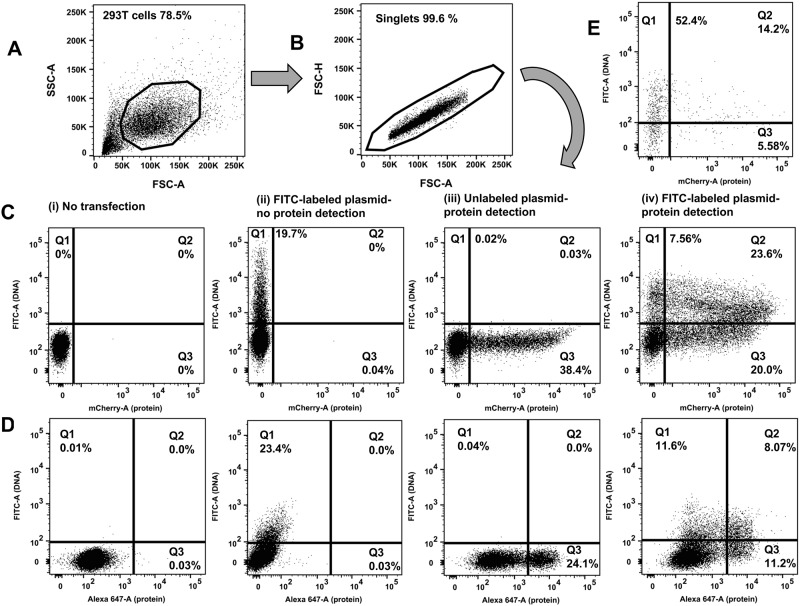
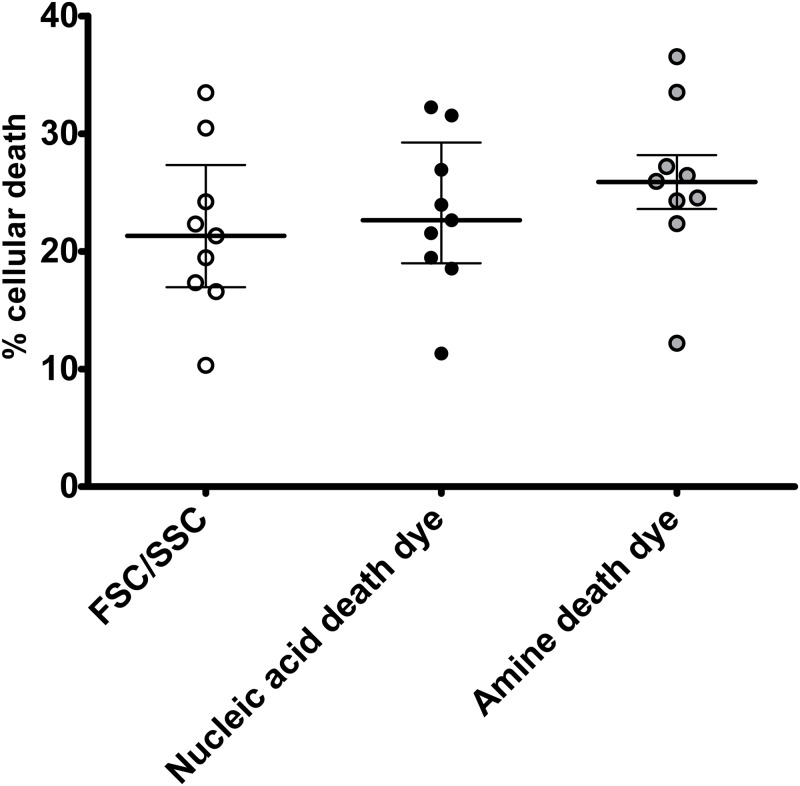
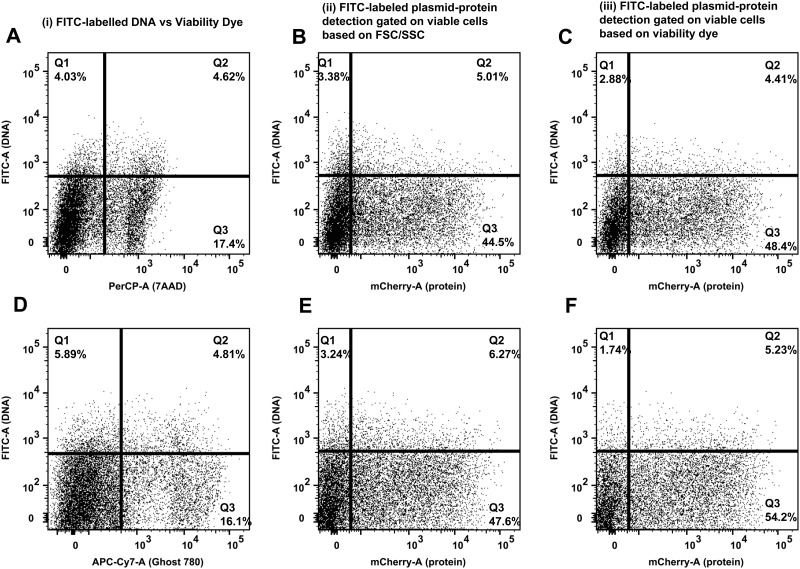
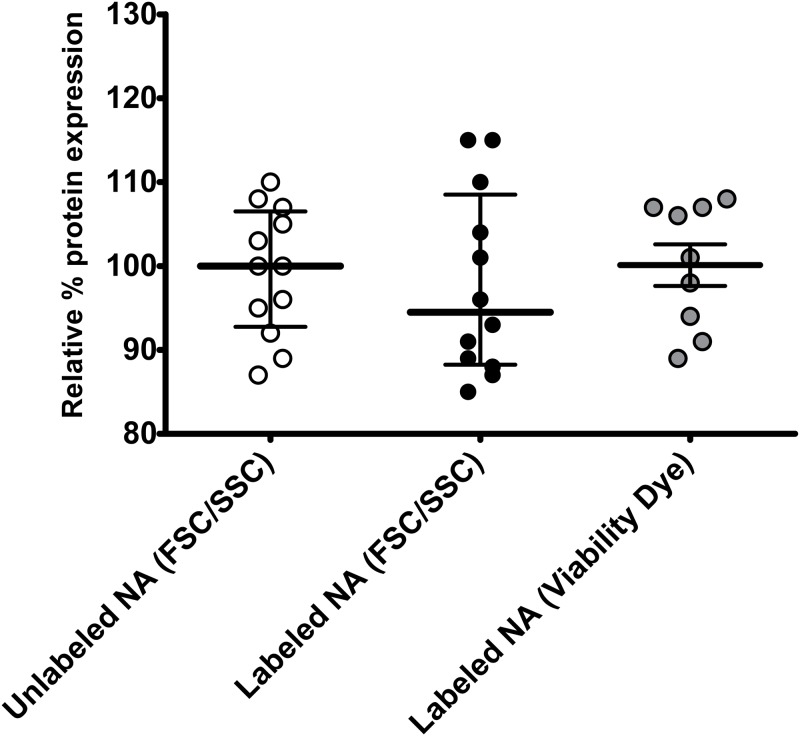
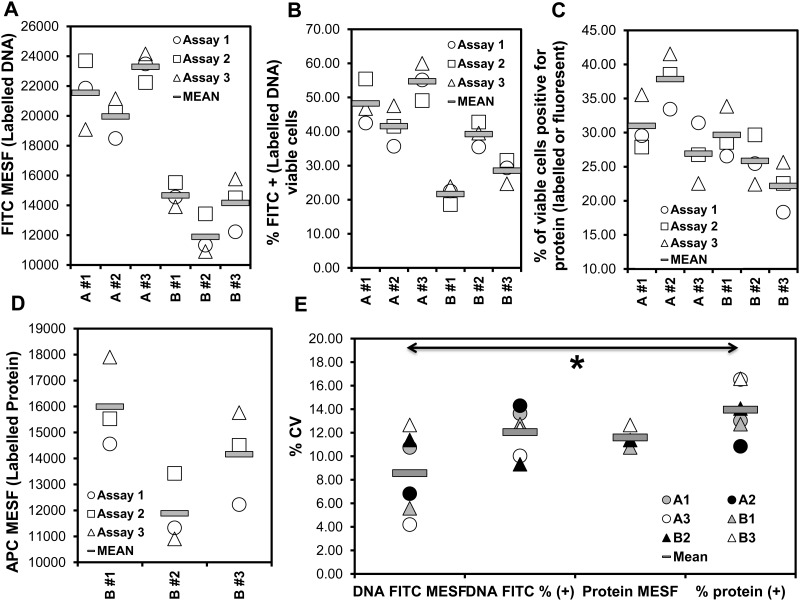
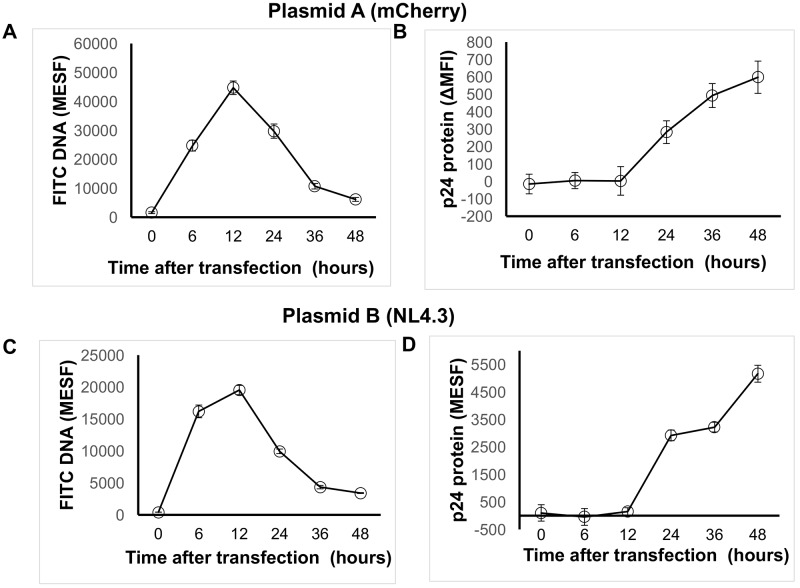
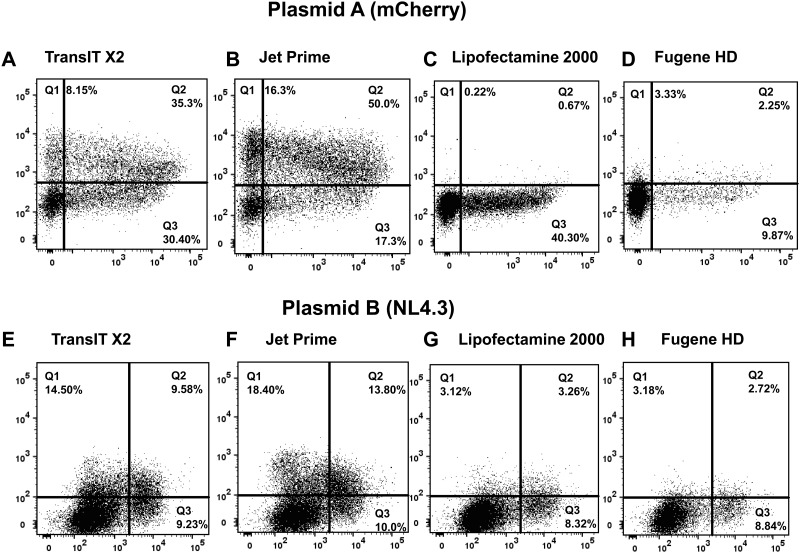
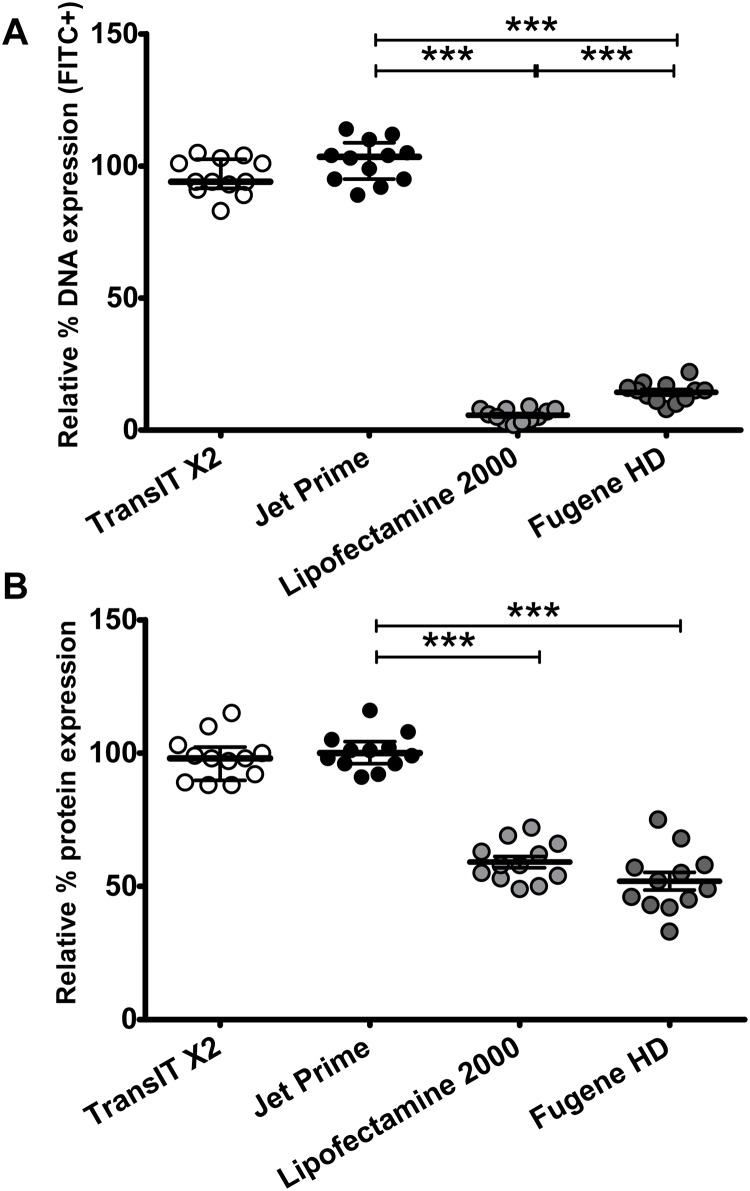
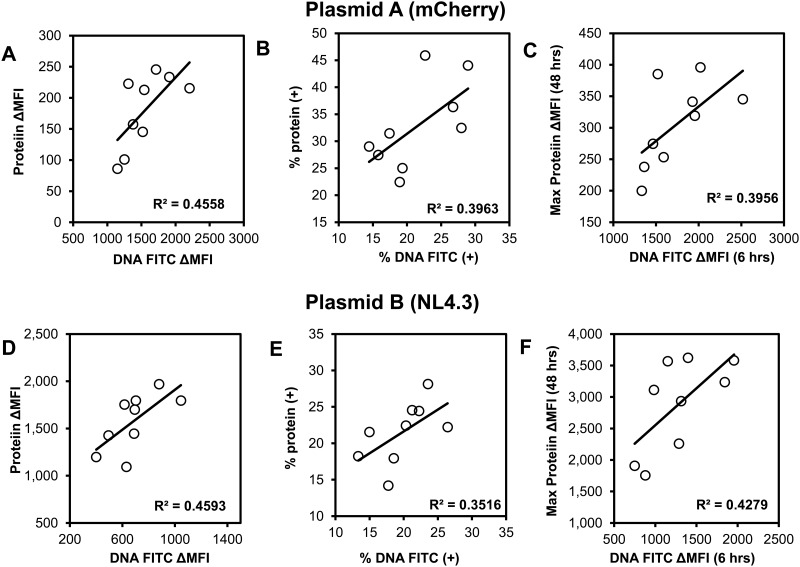
Transfection is one of the most frequently used techniques in molecular biology that is also applicable for gene therapy studies in humans. One of the biggest challenges to investigate the protein function and interaction in gene therapy studies is to have reliable monospecific detection reagents, particularly antibodies, for all human gene products. Thus, a reliable method that can optimize transfection efficiency based on not only expression of the target protein of interest but also the uptake of the nucleic acid plasmid, can be an important tool in molecular biology. Here, we present a simple, rapid and robust flow cytometric method that can be used as a tool to optimize transfection efficiency at the single cell level while overcoming limitations of prior established methods that quantify transfection efficiency. By using optimized ratios of transfection reagent and a nucleic acid (DNA or RNA) vector directly labeled with a fluorochrome, this method can be used as a tool to simultaneously quantify cellular toxicity of different transfection reagents, the amount of nucleic acid plasmid that cells have taken up during transfection as well as the amount of the encoded expressed protein. Finally, we demonstrate that this method is reproducible, can be standardized and can reliably and rapidly quantify transfection efficiency, reducing assay costs and increasing throughput while increasing data robustness.


Conflict of interest statement

Competing Interests: The authors have declared that no competing interests exist.

Figures

Fig 1
Fig 1. Flow cytometric determination of transfection efficiency based on two independent readouts (DNA plasmid uptake and protein expression).
Representative transfections are shown. 293T cells underwent chemical transfection using the TransITX2 transfection reagent as described in Methods. The same amount (1 μg) of DNA was used for two independent plasmids: a small (B: pUltraHot expressing mCherry, 8.3 kb) and a large (C: pNL4-3 expressing p24, 14.0 kb) DNA plasmid. Gating strategy is shown: A) forward and side scatter B) discrimination of doublets C, D) two independent readouts of transfection efficiency. FITC fluorescence corresponds to the uptake of FITC-labeled plasmid DNA (y-axis). A fluorochrome that has no spectral overlap with FITC is used to quantify protein expression. Either a fluorescent protein can be used (e.g. mCherry; shown in C) or a protein labeled with a fluorescent-labeled antibody (e.g. intracellular expression of HIV-1 p24 protein was detected by an CF647-labeled anti-p24 antibody; shown in D). Co-expression of DNA taken up by cells and target protein were analyzed 24 h after transfection. The numbers in the quadrants indicate the percentages of viable cells that took up the FITC labeled DNA plasmid versus the expressed protein that was detected. The following dot plots are shown for each chemical transfection in 293T cells: i) untransfected cells (negative control), ii) cells transfected with FITC-labeled DNA plasmid harvested before protein expression occurred (3 hours post transfection), iii) cells transfected with unlabeled plasmid harvested 24 hours after transfection (when protein expression can be quantified) iv) cells transfected with FITC-labeled DNA plasmid and harvested 24 hours after transfection (when protein expression can be quantified). In this plot Q3 quadrant demonstrates many cells that express protein but do not show any fluorescence associated with uptake of the plasmid DNA. This may reflect effects of the cellular machinery on FITC fluorescence (see Discussion). Either Q1+Q2 (DNA signal) or Q2+Q3 (protein signal) should be used as readouts of transfection efficiency. E. Transfection efficiency was quantified in human lymphocytes (Jurkat E6 cells) harvested 24 hours after electroporation with FITC-labeled DNA mCherry plasmid without the need to use co-transfection of 2 different plasmids and GFP reporter.
Fig 2
Fig 2. Labeling of the transfected nucleic acids did not affect their function.
293T cells underwent chemical transfection using labeled or standard transfected nucleic acids (pNL4-3 or mCherry plasmids) and the TransITX2 transfection reagent as described in Methods. Jurkat E6 cells underwent electroporation with FITC-labeled DNA mCherry plasmid as described in Methods. Each experiment was performed in triplicates and three independent times with specific (un)labelled nucleic acids. Viable cells were gated based on either forward and side scatter (FSC/SSC) or viability dye as shown in Fig 3 and transfection efficiency was determined by comparing protein expression compared to untransfected control. Data in each experiment were normalized by the average of the experimental control (standard transfected nucleic acids) in each experiment and were then pooled together. This approach increases statistical power while taking into consideration the inherent differences in transfection efficiency among different transfection methods (chemical transfection versus electroporation in 293T cells versus Jurkat E6 cells). The non-parametric statistical Kruskal-Wallis test was used for comparisons between the labeled and unlabeled transfected nucleic acids. Median and interquartile range (IQR) are shown. The use of unlabeled transfected nucleic acids (standard transfection method) lead to similar protein expression of target gene [100, (14)] compared to the labeled transfected nucleic acids, regardless of the method of viability gating (FSC/SSC; 94.5, (20) vs viability dye; 101 (16)] (p = 0.745).
Fig 3
Fig 3. Determination of cell viability in described flow cytometric method that quantifies transfection efficiency.
Representative transfections are shown. 293T cells underwent chemical transfection using the TransITX2 transfection reagent and the mCherry plasmid as described in Fig 1. Cell viability and co-expression of DNA taken up by cells and target protein were analyzed 24 h after transfection. Cell viability was assessed by flow cytometry using two independent approaches: a) viable cells were gated based on forward and side scatter as shown in Fig 1 b) viable cells were gated based on nucleic acid [7-AAD: 7-Aminoactinomycin D, A-C] and amine reactive (Ghost 780 Live/dead dye, D-F) viability dyes. Representative plots from 3 independent experiments are shown. As expected the chemical transfection and the DNA plasmids per se are toxic to the cells. Similar data were obtained using 2 independent viability dyes [7AAD (A), Ghost 780 (D)]. Overall cellular toxicity was similar (10–40%) among the 3 methods [FSC/SSC (Fig 1), nucleic acid and amine reactive death dyes](Fig 4). The mean viability of the untransfected 293T cells was >85%. In addition, determination of the transfection efficiency based on two independent readouts (DNA plasmid uptake and protein expression) was similar by gating on viable cells based on either FSC/SSC (B, E) or viability dye (C, F).
Fig 4
Fig 4. Cellular toxicity can be determined in described flow cytometric method that quantifies transfection efficiency without the use of a viability dye.
293T cells underwent chemical transfection using labeled or standard transfected nucleic acids (pNL4-3 or mCherry plasmids) and the TransITX2 transfection reagent as described in Methods. Gating on viable cells was performed as shown in Fig 1. Each experiment was performed in triplicates and three independent times with specific (un)labelled nucleic acids. Median and interquartile range (IQR) are shown. The non-parametric statistical Kruskal-Wallis test was used for comparisons between groups. Quantification of cell death by forward and side scatter parameters, and doublet discrimination [18.4% (8.6)] gave similar results compared to quantification of cell death by nucleic acid viability dye (7-AAD) [20.50% (11.7)] and amine viability dye [24.4 (11.1)](p = 0.379). Of note use of viability cell dye cannot be used in electroporation experiments (e.g. Jurkat E6 cells electroporation with FITC-labeled DNA mCherry plasmid) due to the mechanisms of action of electroporation methods and dye exclusion tests for cell viability dyes.
Fig 5
Fig 5. Standardization and reproducibility of described flow cytometric method that quantifies transfection efficiency.
Three different stocks of 293T cells (1–3,<20 passages) underwent chemical transfection using the TransITX2 transfection reagent and the mCherry plasmid (plasmid A) and the NL4.3 plasmid (plasmid B) as described in Fig 1. Co-expression of DNA taken up by cells and target protein were analyzed 24 h after transfection. MESF (Molecules of Equivalent Soluble Fluorochrome) beads were used to standardize median fluorescence intensity (MFI) units as described in Methods. The four measures of transfection efficiency [A: MESF of FITC (labeled DNA) in viable cells, B: % FITC+ (labeled DNA) of viable cells, C: % viable cells positive for protein (labelled or fluorescent), D: MESF of fluorochrome used to label protein (APC in this case) in viable cells] are means of triplicates from three independent experiments (Assay 1–3) and are plotted in A-D. Note that MESF beads are not available for mCherry and in this case the MFI can be used to quantify levels of expression of protein per cell. The comparison of the coefficient of variation (CV%) among the 4 independent readouts is shown in E. The mean inter-assay variability for these six samples (A1-3, B1-3) for the different readouts (A-D) was as follows: A: 8.56% (range 4.19 to 12.66%), B: 12.06% (range 9.32 to 14.30%), C: 11.59% (range 10.75 to 12.66%), D: 13.96% (range 10.84 to 16.59%). The readout A was more reproducible (p<0.05, ANOVA). Similar standardization can be established with various cells and transfection methods (e.g. Jurkat E6 cells electroporation with FITC-labeled DNA mCherry plasmid).
Fig 6
Fig 6. Flow cytometric analysis of DNA uptake and protein expression over time in described flow cytometric method that quantifies transfection efficiency.
293T cells (<20 passages) underwent chemical transfection using the TransITX2 transfection reagent and the mCherry plasmid (plasmid A; A, B) or the NL4.3 plasmid (plasmid B; C, D) as described in Fig 1. Co-expression of DNA taken up by cells (A, C) and target protein (B, D) were analyzed at 6, 12, 24, 36 and 48 hours after transfection. Data are means of triplicates from three independent experiments. Median fluorescence intensity was subtracted from the respective untransfected control (ΔMFI) as described in Methods. Fluorescence intensities were standardized using a MESF standard curve as described in methods. Note that MESF beads are not available for mCherry and in this case the MFI can be used to quantify levels of expression of protein per cell.
Fig 7
Fig 7. Comparison of major commercially available transfection reagents using described flow cytometric method that quantifies transfection efficiency.
293T cells underwent chemical transfection using different commercially available transfection reagents and the mCherry plasmid (plasmid A; A, B, C, D) or the NL4.3 plasmid (plasmid B; E, F, G, H) as described in Fig 1. Co-expression of DNA taken up by cells and target protein were analyzed at 24 hours after transfection. Data are means of triplicates from three independent experiments. For each reagent the ratio of transfection reagent to DNA amount was optimized as per manufacturer`s instructions and the same (1 μg) amount of DNA was used.
Fig 8
Fig 8. Comparison of major commercially available transfection reagents using described flow cytometric method that quantifies transfection efficiency.
293T cells underwent chemical transfection using labeled or standard transfected nucleic acids (pNL4-3 or mCherry plasmids) and different commercially available transfection reagents as described in Methods. Gating on viable cells was performed as shown in Fig 1. Each experiment was performed in triplicates and six independent times (6 per plasmid and 12 in total) with specific (un)labelled nucleic acids. Data in each experiment were normalized by the average of the experimental control (standard transfected nucleic acids) in each experiment and were then pooled together. This approach increases statistical power while taking into consideration the inherent differences in transfection efficiency among different transfection methods (different chemical transfection reagents and plasmids). The non-parametric statistical Mann-Whitney test was used for comparisons between groups. Median and interquartile range (IQR) are shown. The transfection efficiency was assessed by both amount of labelled DNA (A) and protein (B). The use of TransIT-X2 and Jet Prime gave the best (and comparable) transfection efficiencies, whereas the efficiency was reduced with Lipofectamine 2000 and Fugene HD. There was a major decrease in the amount of detectable labelled DNA with Lipofectamine 2000 and Fugene HD.
Fig 9
Fig 9. Correlations between readouts of described flow cytometric method that quantifies transfection efficiency.
293T cells (<20 passages) underwent chemical transfection using the TransITX2 transfection reagent and the mCherry plasmid (plasmid A, A-C) or the NL4.3 plasmid (plasmid B, D-F) as described in Fig 1. Co-expression of DNA taken up by cells and target protein were analyzed at 6 (C,F), 24 (A,B, D, E) and 48 (C, F) h after transfection. Median fluorescence intensity was subtracted from the respective untransfected control (ΔMFI) as described in Methods. Spearman correlations between the same readouts (% positive of viable cells vs ΔMFI in viable cells) are shown for labeled DNA vs labeled protein for the two different plasmids. Overall, ΔMFIs correlated better than % positivity of viable cells (all p values≤0.05). In addition an early (6 hours) readout from labeled DNA (FITC) correlated significantly with the maximum (48 hours) ΔMFI that corresponded to expression of protein per cell (C, F).

References

    1. Stoll SM, Calos MP. Extrachromosomal plasmid vectors for gene therapy. Curr Opin Mol Ther. 2002;4(4):299–305. . - PubMed
    1. Kim TK, Eberwine JH. Mammalian cell transfection: the present and the future. Anal Bioanal Chem. 2010;397(8):3173–8. doi: 10.1007/s00216-010-3821-6 . - DOI - PMC - PubMed
    1. Zhou ZL, Sun XX, Ma J, Man CH, Wong AS, Leung AY, et al. Mechanical oscillations enhance gene delivery into suspended cells. Sci Rep. 2016;6:22824 doi: 10.1038/srep22824 . - DOI - PMC - PubMed
    1. Wang L, Zhang J, Zhang R, Xue F, Sun Y, Han X. Limitation in use of luciferase reporter genes for 3'-untranslated region analysis. Biotechnol Lett. 2007;29(11):1691–6. doi: 10.1007/s10529-007-9448-9 . - DOI - PubMed
    1. Wilson SM, Bacic A. Preparation of plant cells for transmission electron microscopy to optimize immunogold labeling of carbohydrate and protein epitopes. Nat Protoc. 2012;7(9):1716–27. doi: 10.1038/nprot.2012.096 . - DOI - PubMed