Case Reports
. 2017 Jun 15;215(12):1862-1872.
doi: 10.1093/infdis/jix201.

A Case of Human Lassa Virus Infection With Robust Acute T-Cell Activation and Long-Term Virus-Specific T-Cell Responses

Affiliations
Case Reports

A Case of Human Lassa Virus Infection With Robust Acute T-Cell Activation and Long-Term Virus-Specific T-Cell Responses

Anita K McElroy et al. J Infect Dis. .

Abstract

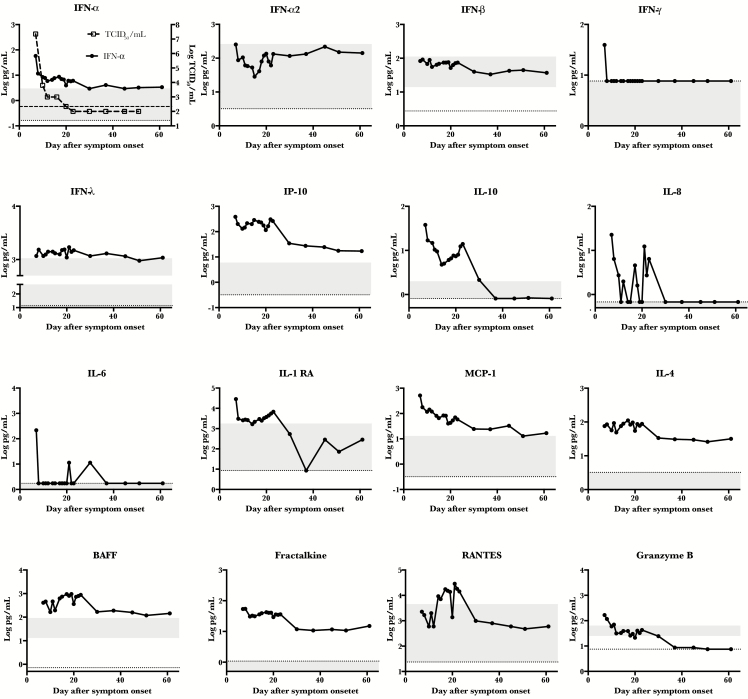
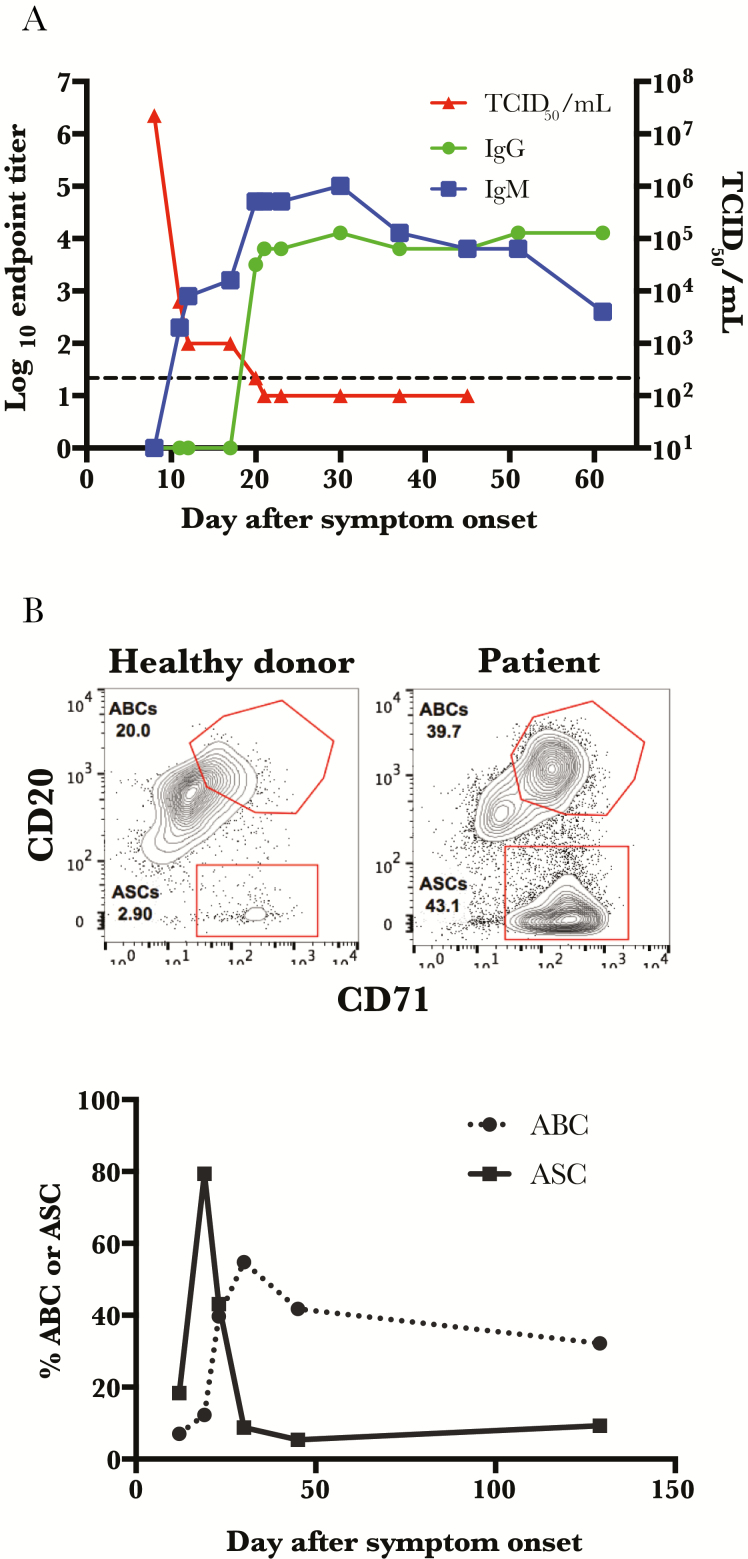
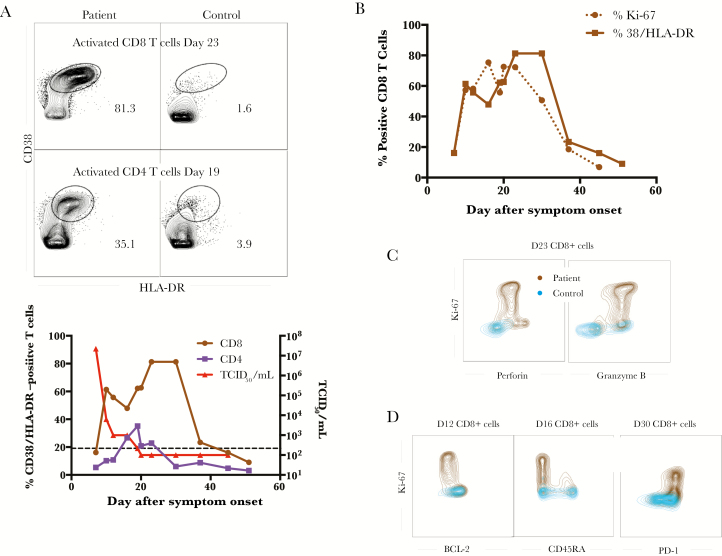
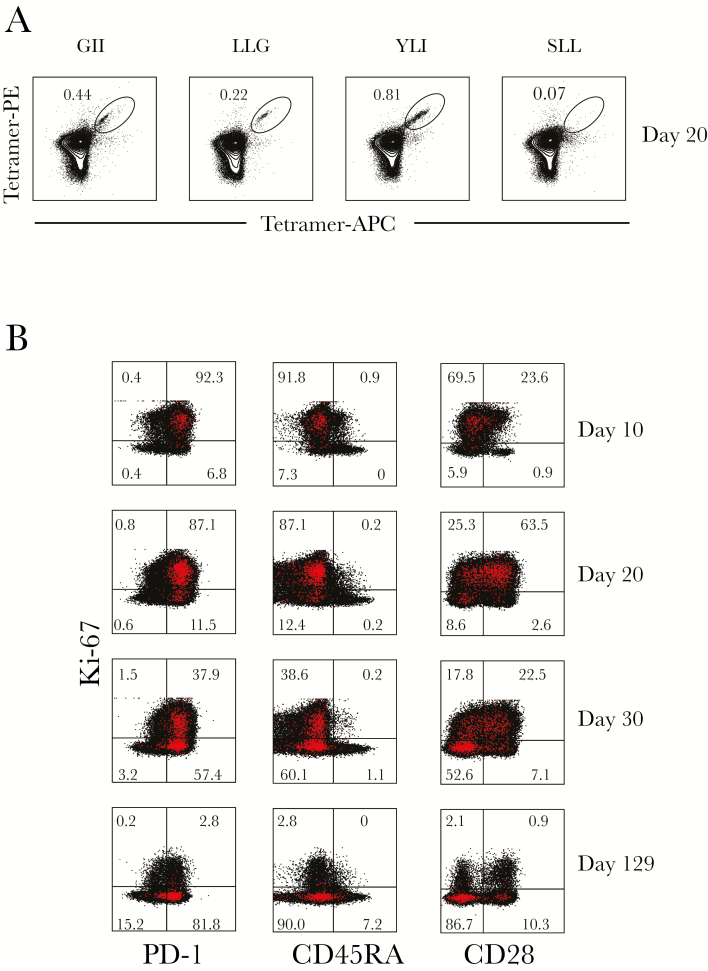
A nurse who acquired Lassa virus infection in Togo in the spring of 2016 was repatriated to the United States for care at Emory University Hospital. Serial sampling from this patient permitted the characterization of several aspects of the innate and cellular immune responses to Lassa virus. Although most of the immune responses correlated with the kinetics of viremia resolution, the CD8 T-cell response was of surprisingly high magnitude and prolonged duration, implying prolonged presentation of viral antigens. Indeed, long after viremia resolution, there was persistent viral RNA detected in the semen of the patient, accompanied by epididymitis, suggesting the male reproductive tract as 1 site of antigen persistence. Consistent with the magnitude of acute T-cell responses, the patient ultimately developed long-term, polyfunctional memory T-cell responses to Lassa virus.

Keywords: Lassa virus; T cells; biomarkers; human; immunology.


Figures

Figure 1.
Figure 1.
Kinetic analysis of various immune markers. Patient plasma was analyzed by multiplex assay for the indicated immune markers over time. The dotted line represents the limit of detection of the assay, and the shaded area represents the range of detection in 10 healthy humans. In the first panel, viral load kinetics were overlaid for comparison, and the hash-marked line represents the limit of detection of the viral load assay. Abbreviations: BAFF, B-cell activating factor; IFN-α, interferon α; IFN-α2, interferon α2; IFN-β, interferon β; IFN-γ, interferon γ; IFN- λ, interferon λ; IL-4, interleukin 4; IL-6, interleukin 6; IL-8, interleukin 8; IL-10, interleukin 10; IL-1RA, interleukin 1 receptor antagonist; IP-10, interferon γ–induced protein 10; TCID50, 50% tissue culture infective dose.
Figure 2.
Figure 2.
Class switching corresponds with peak frequency of antibody-secreting cells. A, Patient samples were analyzed by enzyme-linked immunosorbent assay for Lassa virus–specific immunoglobulin M and immunoglobulin G responses, and viral loads were determined by 50% tissue culture infective dose assay. The hash-marked line represents the limit of detection of the viral load assay. B, Representative flow plots for both antibody-secreting cells (ASCs; CD3 CD14 CD16 IgD CD19+ CD20loCD71+) and activated B cells (ABCs; CD3 CD14 CD16 IgD CD19+ CD20++ CD71+) are depicted for both the patient (at day 23) and a healthy control, and frequencies of ASCs and ABCs were assessed over time. Abbreviations: ABC, activated B cell; ASC, antibody-secreting cell; IgG, immunoglobulin G; IgM, immunoglobulin M; TCID50, 50% tissue culture infective dose.
Figure 3.
Figure 3.
T-cell activation was prolonged and had an effector phenotype. A, Representative flow plots of activated CD8 (top) and CD4 (bottom) T cells are depicted for both the patient and a healthy control, and frequencies of CD38+/HLA-DR+ CD8 and CD4 T cells were assayed over time. The viral load is also overlaid for comparison. The hash-marked line represents the limit of detection of the viral load assay. B, The frequency of CD38/HLA-DR double-positive CD8 T cells as compared with the frequency of Ki-67+ CD8 T cells. Representative flow plots showing the functionality (C) of the K-67+ CD8 T cells and their phenotype (D). Abbreviation: TCID50, 50% tissue culture infective dose.
Figure 4.
Figure 4.
Tetramer-specific CD8 T cells are of the effector phenotype. A, Tetramers GII, LLG, YLI, and SLL were generated based upon HLA-A2 predicted peptides from the Lassa virus GPC protein, and the frequency of tetramer-specific CD8 T cells at day 20 is shown. B, Additional phenotyping of the highest frequency tetramer, YLI, over time. Tetramer-positive cells are depicted in red. Abbreviations: APC, allophycocyanin; PE, phycoerythrin.
Figure 5.
Figure 5.
Total CD8 T-cell phenotyping reveals a predominance of effector-type cells during the acute phase. CD8 T cells were analyzed for expression of PD-1, CD28, CCR7, CD45RA, Ki-67, and perforin using flow cytometry at different time points to characterize the phenotypes of the total CD8 T-cell population during infection.
Figure 6.
Figure 6.
Greatest magnitude of Lassa virus–specific CD4 T-cell function was observed during the acute phase of infection. A, Ex vivo stimulation followed by flow cytometry was used to examine cytokine expression from CD4 T cells upon stimulation with viral antigen. B, SPICE plots were generated to demonstrate the fraction of Lassa-specific cells that were producing each cytokine in response to antigen stimulation at each time point. Pie wedge colors refer to the legend below, whereas pie arc colors refer to the legend to the right. Abbreviations: IFN-γ, interferon γ; IL-2, interleukin 2; TNF-α, tumor necrosis factor α.
Figure 7.
Figure 7.
Greatest degree of Lassa virus–specific CD8 T-cell polyfunctionality was observed in convalescence. A, Ex vivo stimulation followed by flow cytometry was used to examine cytokine expression from CD8 T cells upon stimulation with viral antigen. B, SPICE plots were generated to demonstrate the fraction of Lassa-specific cells that were producing each immune marker in response to antigen stimulation at each time point. Pie wedge colors refer to the legend below, whereas pie arc colors refer to the legend to the right. Abbreviations: IFN-γ, interferon γ; IL-2, interleukin 2; TNF-α, tumor necrosis factor α.

Comment in

Similar articles

Cited by

References

    1. McCormick JB, King IJ, Webb PA et al. A case–control study of the clinical diagnosis and course of Lassa fever. J Infect Dis 1987; 155:445–55. - PubMed
    1. McCormick JB. Clinical, epidemiologic, and therapeutic aspects of Lassa fever. Med Microbiol Immunol 1986; 175:153–5. - PubMed
    1. Flatz L, Rieger T, Merkler D et al. T cell–dependence of Lassa fever pathogenesis. PLoS Pathog 2010; 6:e1000836. - PMC - PubMed
    1. Oestereich L, Lüdtke A, Ruibal P et al. Chimeric mice with competent hematopoietic immunity reproduce key features of severe Lassa fever. PLoS Pathog 2016; 12:e1005656. - PMC - PubMed
    1. Baize S, Kaplon J, Faure C, Pannetier D, Georges-Courbot MC, Deubel V. Lassa virus infection of human dendritic cells and macrophages is productive but fails to activate cells. J Immunol 2004; 172:2861–9. - PubMed

Publication types

MeSH terms