. 2017 Nov;7(11):1248-1265.
doi: 10.1158/2159-8290.CD-17-0401. Epub 2017 Sep 1.

Recurrent Tumor Cell-Intrinsic and -Extrinsic Alterations during MAPKi-Induced Melanoma Regression and Early Adaptation

Affiliations

Recurrent Tumor Cell-Intrinsic and -Extrinsic Alterations during MAPKi-Induced Melanoma Regression and Early Adaptation

Chunying Song et al. Cancer Discov. 2017 Nov.

Abstract

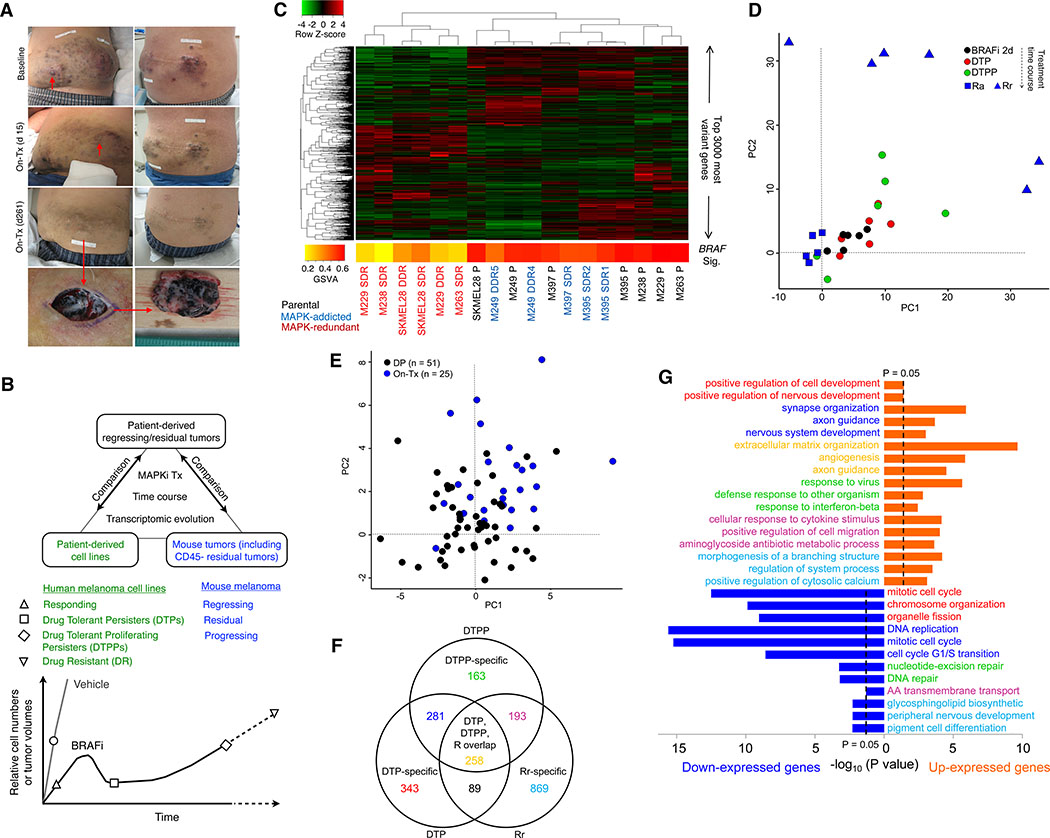
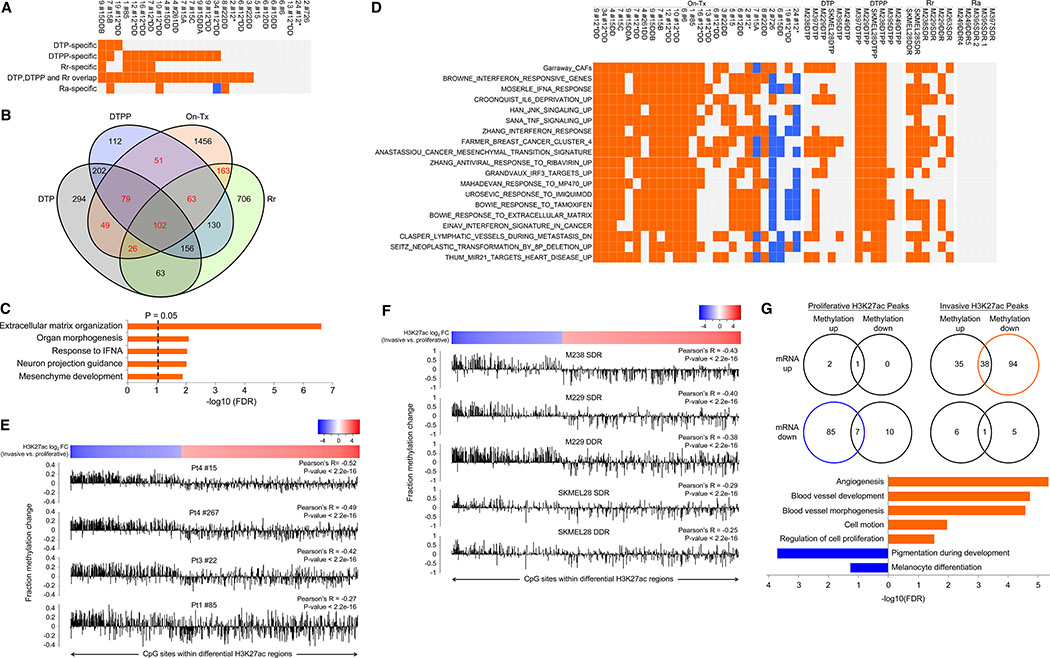
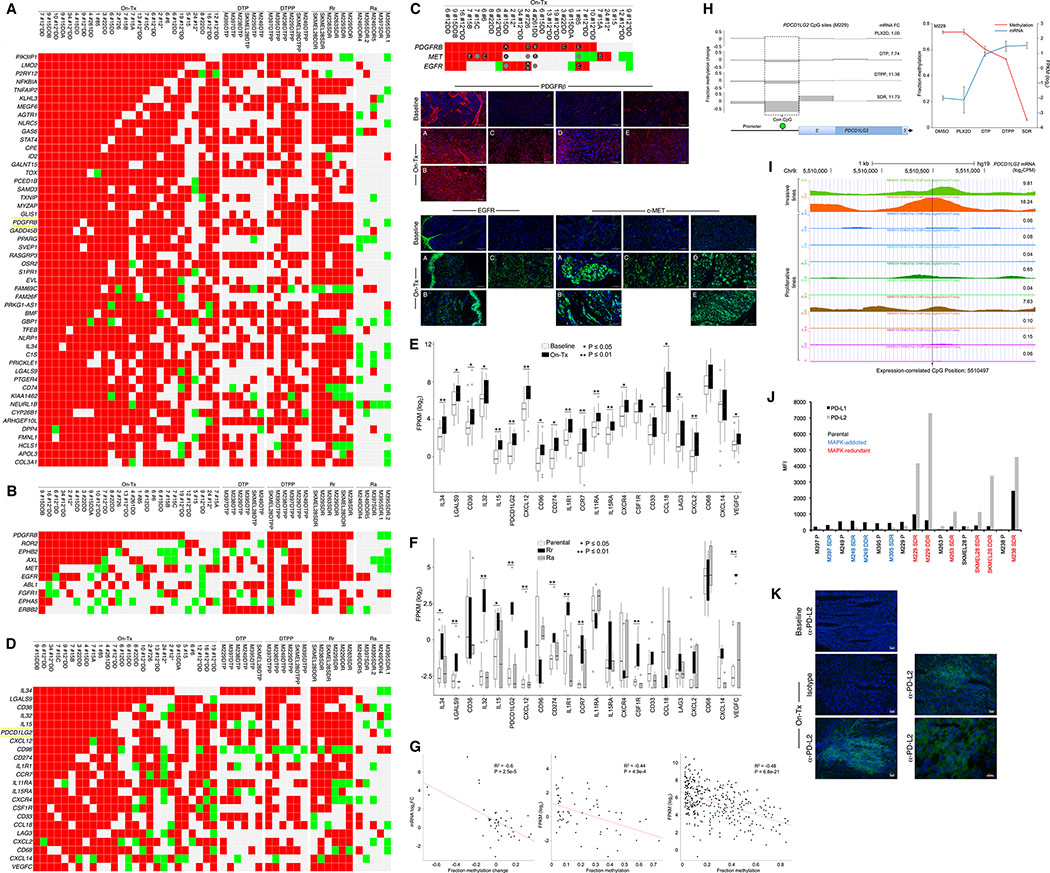
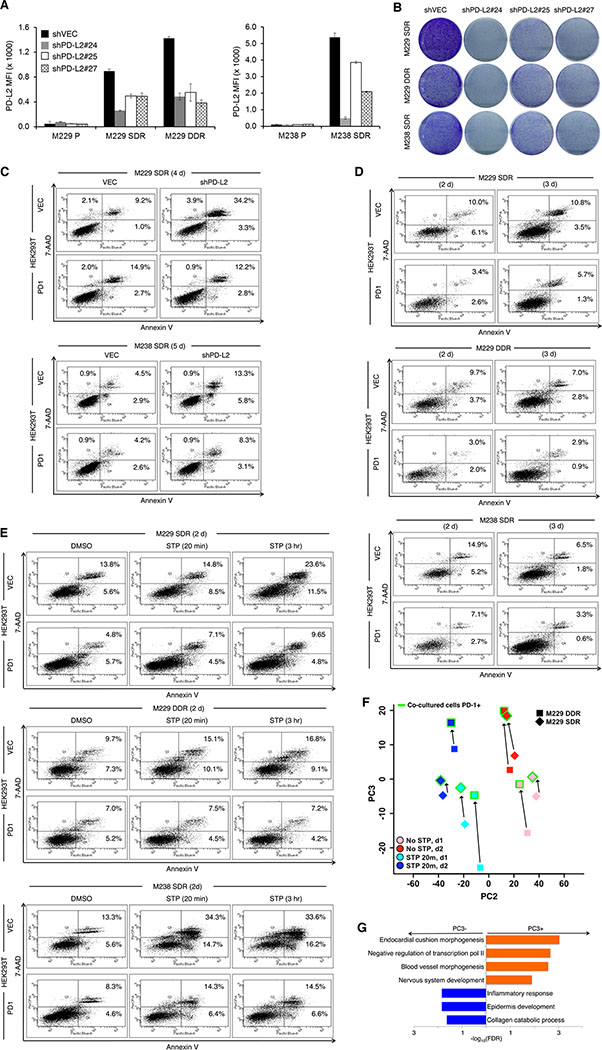
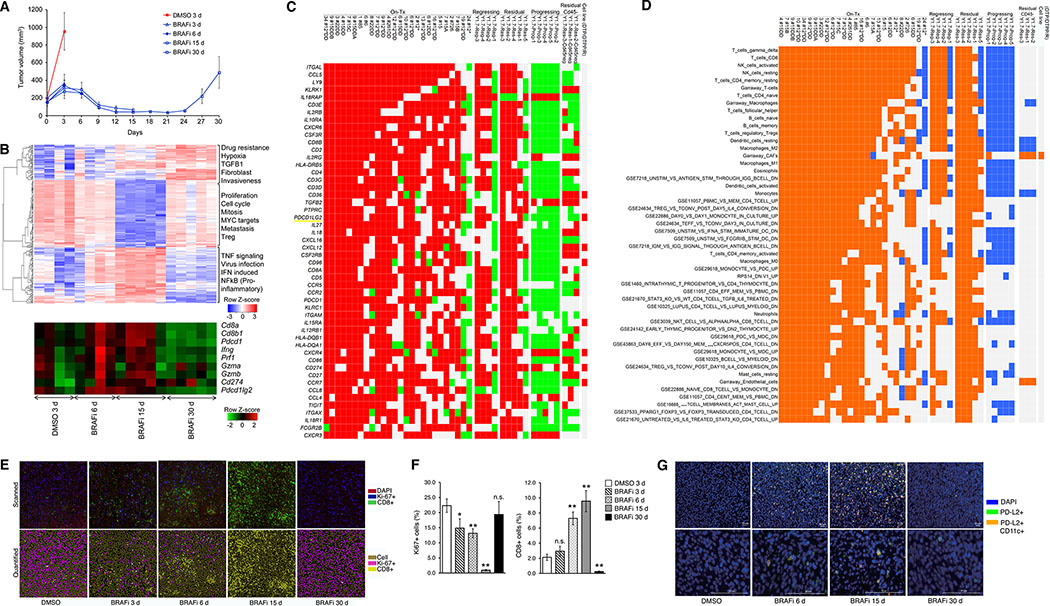
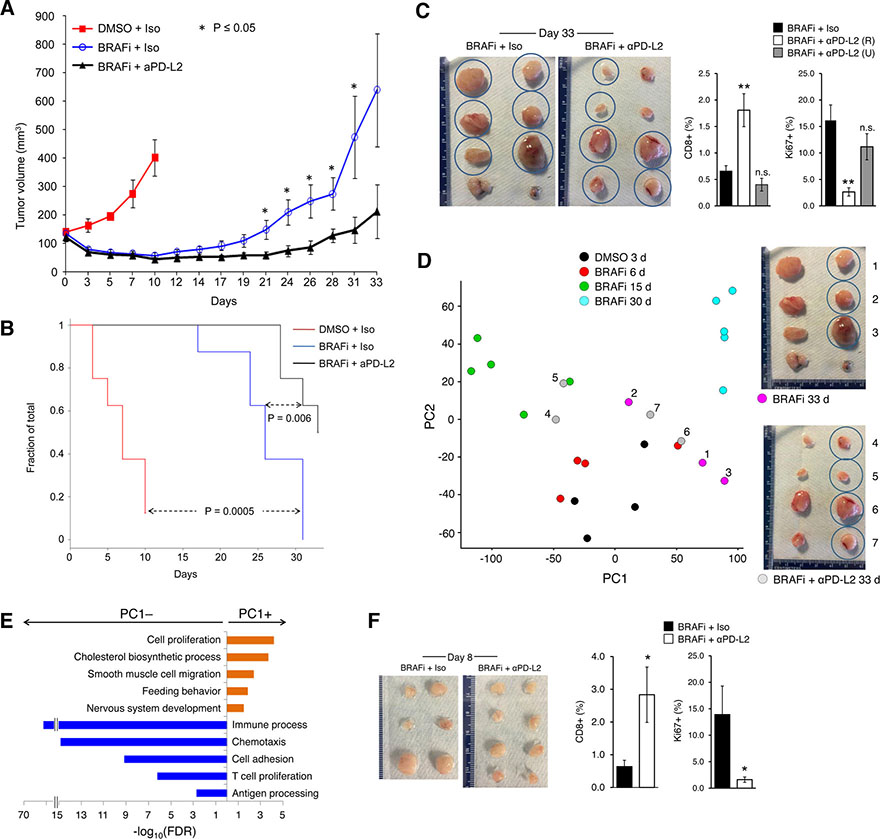
Treatment of advanced BRAFV600-mutant melanoma using a BRAF inhibitor or its combination with a MEK inhibitor typically elicits partial responses. We compared the transcriptomes of patient-derived tumors regressing on MAPK inhibitor (MAPKi) therapy against MAPKi-induced temporal transcriptomic states in human melanoma cell lines or murine melanoma in immune-competent mice. Despite heterogeneous dynamics of clinical tumor regression, residual tumors displayed highly recurrent transcriptomic alterations and enriched processes, which were also observed in MAPKi-selected cell lines (implying tumor cell-intrinsic reprogramming) or in bulk mouse tumors (and the CD45-negative or CD45-positive fractions, implying tumor cell-intrinsic or stromal/immune alterations, respectively). Tumor cell-intrinsic reprogramming attenuated MAPK dependency, while enhancing mesenchymal, angiogenic, and IFN-inflammatory features and growth/survival dependence on multi-RTKs and PD-L2. In the immune compartment, PD-L2 upregulation in CD11c+ immunocytes drove the loss of T-cell inflammation and promoted BRAFi resistance. Thus, residual melanoma early on MAPKi therapy already displays potentially exploitable adaptive transcriptomic, epigenomic, immune-regulomic alterations.Significance: Incomplete MAPKi-induced melanoma regression results in transcriptome/methylome-wide reprogramming and MAPK-redundant escape. Although regressing/residual melanoma is highly T cell-inflamed, stromal adaptations, many of which are tumor cell-driven, could suppress/eliminate intratumoral T cells, reversing tumor regression. This catalog of recurrent alterations helps identify adaptations such as PD-L2 operative tumor cell intrinsically and/or extrinsically early on therapy. Cancer Discov; 7(11); 1248-65. ©2017 AACR.See related commentary by Haq, p. 1216This article is highlighted in the In This Issue feature, p. 1201.


Conflict of interest statement

Authors declare no conflicts of interest.

Figures

Figure 1.
Figure 1.
Nongenomic evolution within regressing/residual clinical tumors on MAPKi therapy. A, Clinical photos of MAPKi therapy (patient #4) showing a partial response and serial tumor biopsies. B, Overall study design of comparative transcriptomic analysis of gene expression alterations in On-Tx tumors (relative to patient-matched baseline tumors) versus gene expression alterations at multiple time points (after initiating MAPKi treatment) in human melanoma cell lines or murine melanoma tumors. C, Heat map showing unsupervised hierarchical clustering based on top variant gene expression levels of parental lines (P-line) and isogenic single drug–resistant (SDR) or double drug–resistant (DDR) lines. Bottom, GSVA enrichments of a BRAFMUT signature. D, PCA of BRAFi-induced temporal transcriptomic states in BRAFMUT melanoma cell lines (P-lines at origin; Ra, resistance with MAPK addiction; Rr, resistance with MAPK-redundancy; Ra or Rr lines include SDR and DDR lines). E, Projection of transcriptomes from pretreatment tumors (origin) versus patient-matched On-Tx or disease progression (DP) tumors onto the PC½ space in D. F, Numbers of up-expressed genes (fold change ≥ 2) in >50% of drug-tolerant persister (DTP), drug-tolerant proliferating persister (DTPP), or Rr lines and their pattern of overlap. G, GO (biological processes) enrichments of temporal stage-specific or overlapping up-expressed and down-expressed (FC ≥ 2) genes in DTP, DTPP, and Rr lines.
Figure 2.
Figure 2.
MAPKi-induced transcriptomic and methylomic alterations shared by patient-derived regressing tumors and cell lines with temporal transcriptomic reprogramming. A, Recurrent enrichment of cell line–derived, stage-specific, and stage-overlapping signatures (see Fig. 1F) across On-Tx tumors from patients. Orange, positive enrichment; blue, negative enrichment. B, Numbers of genes recurrently up-expressed (>50% of cell line samples; 2-fold) in DTP, DTPP, or Rr lines versus On-Tx tumors (≥50% of tissue samples; 1.5-fold) and their overlaps. C, GO enrichments of overlapping up-expressed genes in B (red numbers). D, Enrichment pattern across On-Tx tumors of gene sets recurrently (>50%) enriched within any of the DTP, DTPP, Rr, or Ra set of samples. E and F, Changes in CpG methylation levels in On-Tx versus baseline tumors in E or SDR or DDR Rr lines versus isogenic P-lines in F at chromosome locations of differential H3K27ac peaks between invasive and proliferative melanoma cultures. R, Pearson correlation between differential CpG methylation and log2 fold change (FC) of H3K27ac levels. P, t test. G, Number of genes proximal to H3K27ac peaks with indicated differential mRNA (FC ≥ 1.5) and CpG methylation (|Δβ| ≥ 10%, FDR adjusted P ≤ 0.05) patterns in Rr lines in F. Bottom, GO enrichments of genes within blue and orange circles.
Figure 3.
Figure 3.
Recurrent tumor cell–intrinsic transcriptomic, RTKinomic, and immune regulomic alterations in regressing melanoma on MAPKi therapy. A, B, Pattern of differential expression of genes in the On-Tx tumor samples with recurrent (>50%) up-expression in any of the DTP, DTPP, Rr, or Ra set of samples (A, top 50 genes; B, RTK genes only; red and green, up-expression and down-expression). C, Immunofluorescence of PDGFRβ, EGFR, and c-MET using formalin-fixed, paraffin-embedded (FFPE) tumor tissues designated by letters (ruler, 100 μm); negative staining by gray circles. D, As in A and B except showing only top recurrently up-expressed immune regulomic genes. E and F, Expression ranges of immune genes in D among baseline versus On-Tx tumors (E) or P versus Rr or Ra lines (F). G (left), Correlation between FCs in PD-L2 mRNA expression and % methylation changes at the expression anticorrelated CpG site of PD-L2 across comparisons of DP versus baseline tumors and Rr versus P lines. Middle, correlation across all samples (from the left panel) and (right) all TCGA melanoma samples. R, Pearson correlation coefficient; P, Student t test. H, Methylation changes at all profiled CpG sites (green bubble, expression-correlated site; left) or absolute methylation levels at the expression-correlated CpG site (right) versus PD-L2 mRNA expression FC (left) or absolute levels (right). All changes relative to vehicle-treated M229. I, H3K27ac chromatin immunoprecipitation sequencing (ChIP-seq) peaks covering the PD-L2 expression–correlated CpG site in invasive versus proliferative melanoma cultures. PD-L2 mRNA levels also shown. J, Median fluorescence intensities (MFI) of PD-L1 and PD-L2 staining in P versus Rr or Ra lines. K, PD-L2 immunofluorescence using frozen tissues from patient #3 (100× scale bar, 50 μm; 400× scale bar, 20 μm). Several views shown for On-Tx tumor.
Figure 4.
Figure 4.
PD-L2 upregulation promotes tumor cell–intrinsic MAPKi resistance. A, PD-L2 surface detection in P and Rr lines with stable expression of empty vector (shVec) or shPD-L2. Error bars, SEM. B, Clonogenic growth of indicated Rr lines, with shVec or indicated shPD-L2, for 9 days. Quantifications relative to each cell line culture with shVec. C, Apoptosis (%) in Rr lines stably expressing shVec or shPD-L2 #9 + #24 on indicated days after lentiviral infection. GFP- (VEC) or PD-1–GFP-expressing HEK293T cells were added to melanoma cell cultures on day 2 of infection at a ratio of 1 to 2. D, Apoptosis on indicated days in Rr lines cocultured from the outset with GFP- (VEC) or PD-1–GFP-expressing HEK293T cells at a ratio of 2 to 1. E, Apoptosis on day 2 in Rr lines pretreated with DMSO or staurosporine (STP; 0.5 μmol/L) for 20 minutes or 3 hours, washed free of STP, and then cocultured with GFP- (VEC) or PD-1–GFP-expressing HEK293T cells at a ratio of 2 to 1. F, PCA of RNA-seq profiles of indicated Rr lines pretreated with DMSO or STP (0.5 μmol/L) for 20 minutes, washed free of DMSO/STP, and cocultured with GFP- (VEC) or PD-1–GFP-expressing HEK293T cells for 1 or 2 days. Live Rr cells were sorted as GFP-negative cells and then RNA-seq profiled. G, GO enrichment analysis of the PC3− and PC3+ driving genes from F.
Figure 5.
Figure 5.
Recurrent transcriptomic alterations in the tumor immune microenvironment of regressing melanoma on MAPKi therapy. A, YUMM1.7 tumor volumes with vehicle (100% DMSO) versus BRAFi (vemurafenib, 100 mg/kg/d gavage) treatment (n = 8 per group; mean and error bars, SEM). B, Gene set variance analysis and differential gene expression in vehicle versus BRAFi-treated YUMM1.7 tumors from A. C, On-Tx tumor profile of un-expressed immune-regulomic genes with support of recurrent un-expression (>50%) in any of the regressing, residual, or progressing set of YUMM1.7 tumors. Also shown is the pattern of differential expression in the CD45-negative fraction of residual YUMM 1.7 tumors and in any of the cell line samples (DTP, DTPP, or Rr) from Fig. 3A. D, Pattern of enrichment in On-Tx tumors (rank ordered by recurrence frequency of positive enrichment) of gene sets with support from YUMM1.7 tumors as in C. E, Representative scanned and quantified images of Ki-67/CD8 immunofluorescence of tumor sections from A (DAPI, nuclear counterstain). F, Ki-67 or CD8 quantifications from E (n = 5 tumors per time point; 2–3 regions per tumor; error bars, SEM; Student t test, P values: *, ≤0.05; **, ≤0.01; n.s., not significant; reference, DMSO 3 d). G, Immunofluorescent costaining of CD11c and PD-L2 of tumor sections from A (scale bar, 20 μm). Representative low and high magnification images shown.
Figure 6.
Figure 6.
PD-L2 blockade delays BRAFi resistance in murine melanoma by enforcing a CD8+ T cell–inflamed residual tumor state. A, YUMM1.7 tumor volumes with indicated treatments (vehicle, 0.1% methylcellulose and 10% DMSO; BRAFi, vemurafenib 100 mg/kg/d gavage; isotype (iso) or aPD-L2 antibody at 300 μg/mouse twice per week i.p.; n = 8 per group; error bars, SEM). Data representative of three independent experiments. B, Progression-free survival (cutoff tumor size at ≥150% of size at treatment initiation) of mice in A. P values, log-rank test. C, Tumors from experiment in A harvested on day 33 available as FFPE tissue for CD8 and Ki-67 quantifications (n = 6, 2, and 4 tumors, BRAFi + isotype, BRAFi + aPD-L2 responsive, BRAFi + aPD-L2, unresponsive, respectively; 3 regions per tumor; error bars, SEM; Student t test, P values: **, ≤0.01; n.s., not significant; reference, BRAFi + isotype). D, Tumors from experiment in A with available RNA-seq profiles analyzed by PCA along with RNA-seq profiles derived from tumors in Fig. 5A. E, GO enrichment analysis of PC1− and PC1+ driving genes from D. F, YUMM1.7 tumors treated with BRAFi + isotype (n = 6) or BRAFi + aPD-L2 (n = 8), harvested on day 8, and analyzed by CD8 and Ki-67 immunofluorescence. Quantification, 3 regions per tumor; error bars, SEM; Student t test, P values: *, ≤0.05; reference, BRAFi + isotype.
Figure 7.
Figure 7.
Tumor cell–intrinsic PD-L2 overexpression promotes BRAFi resistance independently of CD8+ T cells. A, Tumor volumes of YUMM1.7 [engineered in vitro with control (Ctrl) vector or PD-L2 overexpression (OE)] following treatment with vehicle (0.1% methylcellulose, 10% DMSO) or BRAFi (chow containing PLX4720 at 417 ppm). Vehicle, n = 8; BRAFi, n = 10; error bars, SEM; P values, Student t test. Data are representative of two independent experiments. B, Representative hematoxylin and eosin images of BRAFi-treated tumors from A at d19 (white arrows, mitotic figures; red, histiocytes; grey, granulocytes; 100× scale bar, 100 μm; 400× scale bar, 20 μm. C, Blinded quantifications of (left) mitosis and (right) histiocytes and granulocytes [average from 10 high power fields (HPF) n = 3 tumors per BRAFi-treated group; error bars, SEM; P values, Student t test]. D, Pd-l2 and Vegfa mRNA levels of indicated YUMM1.7 tumor groups. Error bars, SEM; P values, Student t test. E, Representative immunofluorescent staining of VEGFA in BRAFitreated tumors (scale bar, 20 μm). F, PCA of RNA-seq profiles from indicated tumor groups (n = 3 tumors nearest the median tumor weights per group). G, GO enrichment analysis of the PC2− and PC2+ driving genes from F. H, Gene set enrichment analysis of YUMM1.7 tumors with or without PD-L2 OE (in both vehicle- and BRAFi-treated conditions; top, Molecular Signature Data Base signatures; bottom, immune cell marker signatures.

Comment in

References

    1. Emery CM, Vijayendran KG, Zipser MC, et al. MEK1 mutations confer resistance to MEK and B-RAF inhibition. Proc Natl Acad Sci U S A 2009;106:20411–6. - PMC - PubMed
    1. Hugo W, Shi H, Sun L, et al. Non-genomic and Immune Evolution of Melanoma Acquiring MAPKi Resistance. Cell 2015;162:1271–85. - PMC - PubMed
    1. Nazarian R, Shi H, Wang Q, et al. Melanomas acquire resistance to B-RAF(V600E) inhibition by RTK or N-RAS upregulation. Nature 2010;468:973–7. - PMC - PubMed
    1. Shi H, Hugo W, Kong X, et al. Acquired Resistance and Clonal Evolution in Melanoma during BRAF Inhibitor Therapy. Cancer Discov 2014;4:80–93. - PMC - PubMed
    1. Shi H, Moriceau G, Kong X, et al. Preexisting MEK1 exon 3 mutations in V600E/KBRAF melanomas do not confer resistance to BRAF inhibitors. Cancer Discov 2012;2:414–24. - PMC - PubMed

MeSH terms