. 2017 Sep 1;2(15):eaan2946.
doi: 10.1126/sciimmunol.aan2946.

An immune clock of human pregnancy

Affiliations

An immune clock of human pregnancy

Nima Aghaeepour et al. Sci Immunol. .

Abstract

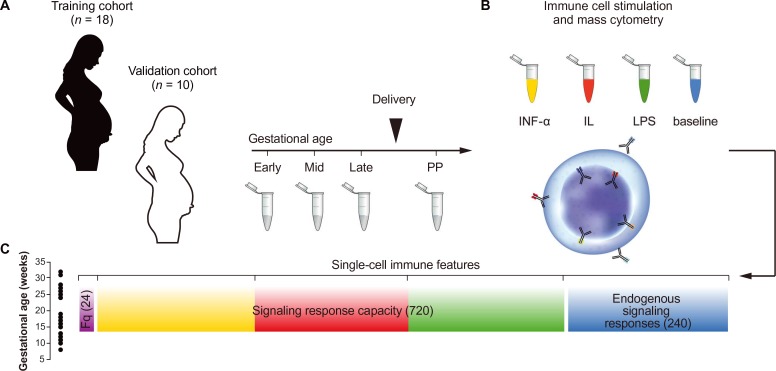
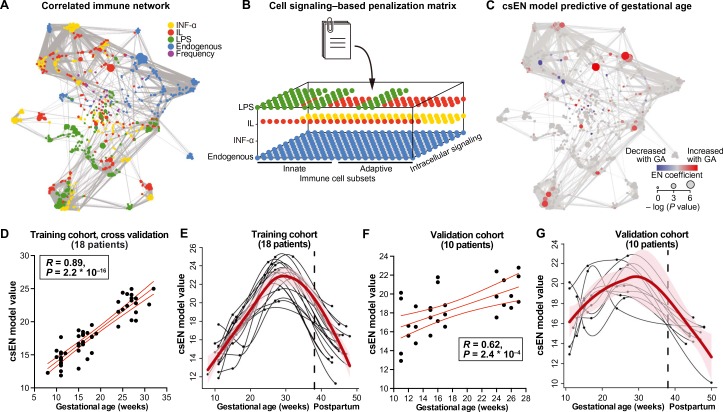
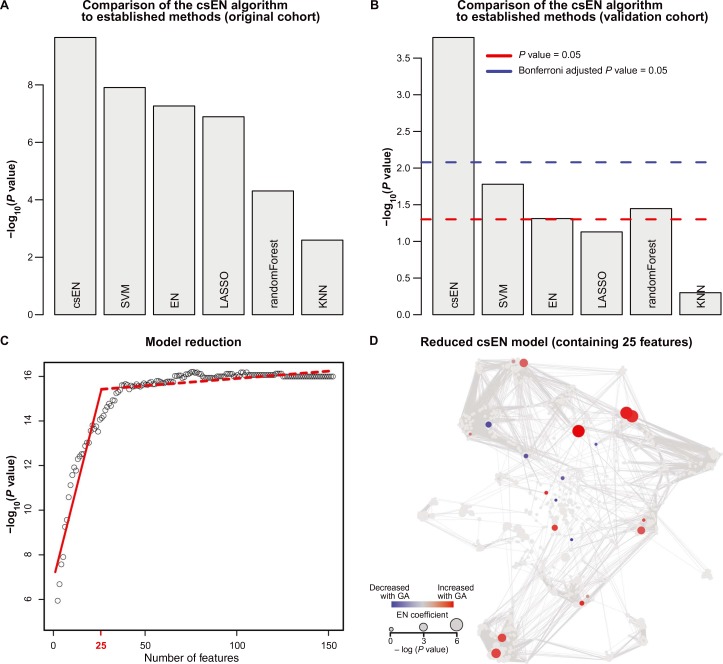
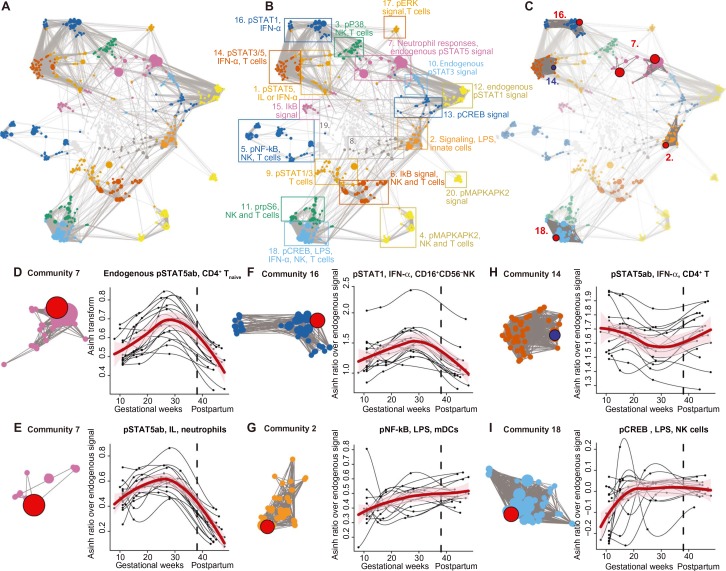
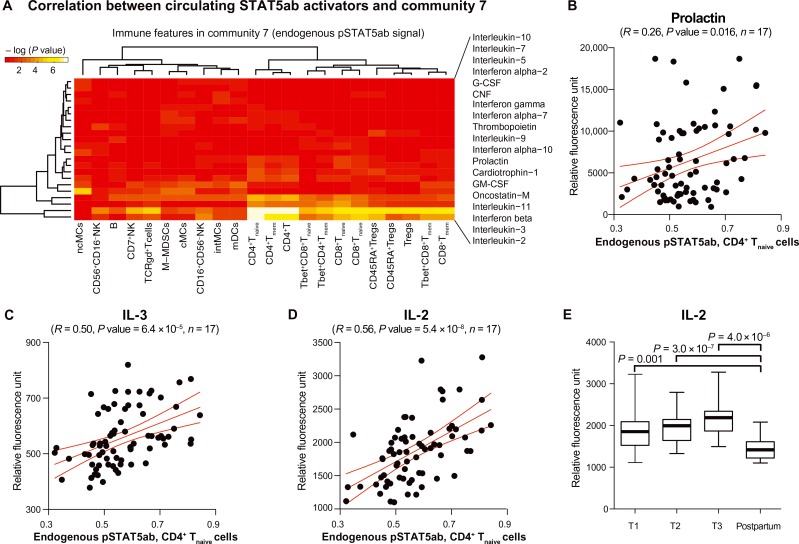
The maintenance of pregnancy relies on finely tuned immune adaptations. We demonstrate that these adaptations are precisely timed, reflecting an immune clock of pregnancy in women delivering at term. Using mass cytometry, the abundance and functional responses of all major immune cell subsets were quantified in serial blood samples collected throughout pregnancy. Cell signaling-based Elastic Net, a regularized regression method adapted from the elastic net algorithm, was developed to infer and prospectively validate a predictive model of interrelated immune events that accurately captures the chronology of pregnancy. Model components highlighted existing knowledge and revealed previously unreported biology, including a critical role for the interleukin-2-dependent STAT5ab signaling pathway in modulating T cell function during pregnancy. These findings unravel the precise timing of immunological events occurring during a term pregnancy and provide the analytical framework to identify immunological deviations implicated in pregnancy-related pathologies.


Conflict of interest statement

G.P.N. has equity in Fluidigm and Becton Dickinson, the manufacturers that produce the reagents or instrumentation used in this manuscript. The other authors declare that they have no competing interests.

Figures

Fig. 1
Fig. 1
Experimental workflow and analytical approach. (A) Eighteen women who delivered at term gestation were initially studied. Ten additional women were subsequently enrolled as a validation cohort. A whole-blood sample was obtained at three time points (early, mid, and late) during pregnancy and 6 weeks postpartum (PP). (B) Aliquots were either left unstimulated (to quantify cell frequency and endogenous intracellular signaling activity) or stimulated with a panel of receptor-specific ligands, including IFN-α, a cocktail of ILs containing IL-2 and IL-6 (IL), and LPS. Immune cells were stained with surface and intracellular antibodies and analyzed with mass cytometry. (C) The assay produced three categories of immune features, providing information about cell frequencies (Fq) measured in 24 manually gated immune cell subsets (purple bar), cell type–specific signaling capacity to respond to exogenous ligands (IFN-α, yellow bar; IL, red bar; LPS, green bar), and endogenous signaling activity (blue bar). The number of immune features contained within each data category is indicated in parentheses. The analyses used the variability in sample collection time to define a continuous variable (gestational age at time of sampling in weeks) distributed across the course of pregnancy (left, black circles).
Fig. 2
Fig. 2
A prospectively validated csEN model accurately predicts dynamic changes of the maternal immune system over the course of pregnancy. (A) Correlation network revealing the relationships between immune features within and acrossmass cytometry data categories (Spearman’s coefficient). (B) Cell signaling–based penalization matrix that allowed prioritizing canonical, receptor-specific signaling responses (see Materials and Methods). Signaling responses amenable to prioritizing are highlighted in blue (endogenous), yellow (IFN-α), red (IL), or green (LPS). (C) Cross-validated csEN model predicting gestational age at time of sampling. Red/blue dots highlight model components that trended upward/downward during pregnancy. Dot size indicates the correlation between model component and gestational age (Spearman’s coefficient). (D and E) Training cohort. (D) csENmodel prediction of the gestational age at time of sampling (R = 0.89, P = 2.2 × 10⁻¹⁶, n = 18, cross-validation). (E) Line plots depicting csEN model values for each patient during pregnancy and for the postpartumsamples. Red lines and red shadow representmedian and 95%confidence interval of EN components. (F and G) Validation cohort. (F) csENmodel prediction of the gestational age at time of sampling (R= 0.62, P= 2.4× 10⁻⁴, n = 10, Spearman’s coefficient). (G) Line plots depicting csEN model values for each patient (validation cohort).
Fig. 3
Fig. 3
Comparison of the csEN algorithmto existing predictive methods and model reduction. (A and B) Comparison of the predictive power of existing algorithms for the estimation of gestational age at time of sampling in the training cohort (A) (n = 18) and the validation cohort (B) (n = 10). Algorithms included Support Vector Machine (SVM), EN, LASSO, randomForest, and k-nearest neighbors (KNN). (C) The dot plot depicts the number of csEN model components versus the P value of the csEN model for predicting gestational age. Red lines indicate the piece-wise regression fit for identification of a breakpoint indicating that 25 features are required for highest statistical stringency. (D) Location of the 25 features in the correlation network.
Fig. 4
Fig. 4
csEN components reveal precisely timed cellular programs that characterize the dynamic changes of the peripheral immune system over the course of pregnancy. (A) The correlation network segregated into 20 communities containing correlated immune features that changed in synchronicity during pregnancy. (B) The 20 communities were annotated on the basis of immune feature attributes (cell subset, stimulation, or signaling property) most commonly represented within each community. (C) Communities containing csEN components most predictive of gestational age are highlighted (red dots) and shown in table S3. Community numbers are indicated in red. (D to I) The five communities containing the most informative EN components of the csEN model (see fig. S2 and table S4). Communities are represented on the left. Graphs on the right depict csEN components (black lines represent each patient; red lines and red shadow represent median and 95% confidence interval, n =18).
Fig. 5
Fig. 5
Correlation between endogenous STAT5ab signaling and circulating plasmafactors. (A) Heat map depicting the correlation between the plasma concentrations (relative fluorescence unit) of known activators of STAT5ab and immune features contained in community 7 (endogenous pSTAT5ab signaling in innate and adaptive cell subsets). Scale proportional to Spearman’s correlation P values (yellow indicates lower P values). (B to D) Correlations between the EN component “endogenous pSTAT5ab in naïve CD4+ T cells” and PRL (B), IL-3 (C), and IL-2 (D) plasma concentrations. The strongest correlation was observed between IL-2 and endogenous pSTAT5ab in naïve CD4+ T cells (R = 0.56, P = 5.4 × 10⁻⁸, n = 17). (E) Box plot depicting IL-2 plasma concentrations at each trimester (T1, T2, and T3) compared with their levels for the postpartum samples. IL-2 concentration increased during pregnancy andwas significantly higher at T1, T2, and T3 comparedwith the postpartumtime points (T1, P = 0.001; T2, P=3.0×10⁻⁷; T3, P = 4.0 × 10⁻⁶, unpaired t test). Median, interquartile range, and 5th to 95th percentiles are shown.

Comment in

  • Pregnancy Around the Clock.
    Diemert A, Arck PC. Diemert A, et al. Trends Mol Med. 2018 Jan;24(1):1-3. doi: 10.1016/j.molmed.2017.11.007. Epub 2017 Dec 5. Trends Mol Med. 2018. PMID: 29203370

References

    1. Erlebacher A., Immunology of the maternal-fetal interface. Annu. Rev. Immunol. 31, 387–411 (2013). - PubMed
    1. PrabhuDas M., Bonney E., Caron K., Dey S., Erlebacher A., Fazleabas A., Fisher S., Golos T., Matzuk M., McCune J. M., Mor G., Schulz L., Soares M., Spencer T., Strominger J., Way S. S., Yoshinaga K., Immune mechanisms at the maternal-fetal interface: Perspectives and challenges. Nat. Immunol. 16, 328–334 (2015). - PMC - PubMed
    1. Romero R., Dey S. K., Fisher S. J., Preterm labor: One syndrome, many causes. Science 345, 760–765 (2014). - PMC - PubMed
    1. Arck P. C., Hecher K., Fetomaternal immune cross-talk and its consequences for maternal and offspring’s health. Nat. Med. 99, 548–556 (2013). - PubMed
    1. Mor G., Cardenas I., Abrahams V., Guller S., Inflammation and pregnancy: The role of the immune system at the implantation site. Ann. N. Y. Acad. Sci. 1221, 80–87 (2011). - PMC - PubMed