. 2017 Oct 26;130(17):1923-1933.
doi: 10.1182/blood-2016-10-740241. Epub 2017 Sep 1.

Eltrombopag: a powerful chelator of cellular or extracellular iron(III) alone or combined with a second chelator

Affiliations

Eltrombopag: a powerful chelator of cellular or extracellular iron(III) alone or combined with a second chelator

Evangelia Vlachodimitropoulou et al. Blood. .

Abstract

Eltrombopag (ELT) is a thrombopoietin receptor agonist reported to decrease labile iron in leukemia cells. Here we examine the previously undescribed iron(III)-coordinating and cellular iron-mobilizing properties of ELT. We find a high binding constant for iron(III) (log β2=35). Clinically achievable concentrations (1 µM) progressively mobilized cellular iron from hepatocyte, cardiomyocyte, and pancreatic cell lines, rapidly decreasing intracellular reactive oxygen species (ROS) and also restoring insulin secretion in pancreatic cells. Decrements in cellular ferritin paralleled total cellular iron removal, particularly in hepatocytes. Iron mobilization from cardiomyocytes exceeded that obtained with deferiprone, desferrioxamine, or deferasirox at similar iron-binding equivalents. When combined with these chelators, ELT enhanced cellular iron mobilization more than additive (synergistic) with deferasirox. Iron-binding speciation plots are consistent with ELT donating iron to deferasirox at clinically relevant concentrations. ELT scavenges iron citrate species faster than deferasirox, but rapidly donates the chelated iron to deferasirox, consistent with a shuttling mechanism. Shuttling is also suggested by enhanced cellular iron mobilization by ELT when combined with the otherwise ineffective extracellular hydroxypyridinone chelator, CP40. We conclude that ELT is a powerful iron chelator that decreases cellular iron and further enhances iron mobilization when combined with clinically available chelators.


Conflict of interest statement

Conflict of interest disclosure: The authors declare no competing financial interests.

Figures
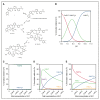
Figure 1
Figure 1. Structure and iron-binding properties of ELT.
Data on the iron-binding properties of ELT were obtained specifically for this article and are not previously published elsewhere. The iron-binding properties of other chelators are based on previously published data., (A) Structure of ELT and its iron complexes are shown. The free ligand possesses 2 tautomers (i and ii). Three major iron(III) complexes have been identified: iii (FeELT), iv (FeELT2H), and v (FeELT2). (B) The speciation of iron(III) in the presence of ELT as a function of pH. [Fe]total=1 μM; [ELT]total=10 μM is shown at steady state (ie, when sufficient time has elapsed for the reactions to go to completion). These proportions are calculated from the iron-binding constants for iron-chelate complexes of the respective chelators shown in Table 1 and determined as described in “Materials and methods.” Titration with iron(III) yielded 3 equilibrium constants: KFeL=25.6, KFeL2H=43.4, and KFeL2= 34.9. ELT has 3 pKa values (the pH at which half the molecules are ionized) of 2.6, 8.7, and 11.1. Using these data, a pFe value of 22.0 (the strength of iron(III) binding, being the negative log of the unbound iron(III) concentration under defined conditions (1 μM iron[III] and 10 μM chelator10) was determined, which is greater than that of DFP (20.4) and very similar to that of DFX (23.1). Competition between ELT and other chelators for iron(III) are shown for (C) 1 μM DFO, (D) 3 μM DFP, and (E) 2 μM DFX. These show the predicted proportions of each ELT iron complex when mixed with a second chelator, after reactions have gone to completion (in steady state). Thus, for example, at 1 μM ELT, more than 99% of iron(III) will be bound to DFO (C), whereas under the same conditions, about half the iron will be bound to DFP (D), and about 70% to DFX (E).
Figure 2
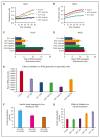
Figure 2. Cellular iron mobilization and/or ferritin iron decrements with ELT from HuH7, H9C2, and RINm5F cells.
(A) Dose response for iron release from HuH7 cells at 8 hours is shown. (B) Dose response for iron release from H9C2 cells at 1, 2, 4, and 8 hours is shown. Cells were loaded with iron, as described in “Materials and methods.” Adherent cells were rinsed 4 times, including 1 wash containing DFO at 30 μM IBE and 3 PBS washes, and subsequently exposed to ELT and other chelators for the times shown. Chelator-containing supernatants were then removed, and the cells washed 4 times as described before lysing with 200 mM NaOH. Intracellular iron concentration was then determined at each point, using the ferrozine assay described in “Materials and methods” and normalized for total cellular protein in each well. Results shown are expressed as the percentage of T0 cellular iron released at the times shown and are the mean ± SEM of 6 replicates in 1 representative experiment. (C) Iron release by ELT 10 μM and DFO, DFP, and DFX 10 μM IBE after 8 hours of treatment in RINm5F cells and (D) iron release by ELT, CP40 and a combination of ELT and CP40 in HuH7 cells. Cells were iron-loaded using two 10-hour changes of 10% FBS-containing RPMI media and rinsed as above. Comparison of the effect of ELT on ferritin and total cellular iron mobilization in (E) HuH7 hepatocyte and (F) H9C2 cardiomyocyte cells is shown. After iron loading, chelator treatment for 8 hours, and rinsing, iron content was ascertained as described earlier. Ferritin was quantified using commercially available enzyme-linked immunosorbent assay kits appropriate for our rat and human cell lines. Results are expressed as the percentage of T0 cellular iron mobilized or decrement of ferritin expressed as percentage of T0 values at the times shown and are the mean ± SEM of 3 replicates of 1 representative experiment.
Figure 3
Figure 3. Effect of ELT and iron chelators on intracellular ROS generation and cell function (insulin production) in iron-loaded cells.
The time-course for ROS inhibition by ELT and other chelators are shown in (A) HuH7 or (B) H9C2 cells. Cells were iron-loaded and then rinsed 4 times, as described earlier. Chelators were then added, and the rate of change of ROS production was recorded as fluorescence change (excitation at 504 nm, emission at 526 nm) continuously over the course of 1 hour in the plate reader at 37°C. DFO, DFP, and DFX were used at 10 μM IBE, and ELT at 10 μM. The rate of ROS production was compared between chelator-treated and chelator-untreated cells. Data shown are readings from individual plates. ROS rate inhibition at 1 hour with CP40, DFO, DFP, DFX, and ELT is shown in (C) HuH7 and (D) H9C2 cells at 10 μM IBE for each chelator and 10 μM ELT and 33 μM IBE CP40. In both cell types, 10 μM ELT shows greater inhibition of ROS than other chelators at the same concentration in both HuH7 and H9C2 cells. The extracellular hydroxypyridinone chelator, CP40, had no effect on ROS. (E) Effect of chelator treatment during a 90-minute period in RINm5F cells on ROS generation is shown. Results are the mean ± SEM of 4 observations in 1 experiment. (F) Effect of iron loading in RINm5F cells with 2 changes of RPMI media containing 10% to 25% FBS on insulin secretion. After treatment, cells were challenged with Kreb’s Ringer buffer containing glucose and insulin concentration in the supernatant determined as described in “Materials and methods.” (G) Effect of chelation treatment on insulin production in RINm5F cells iron-loaded with two 10-hour changes of RPMI media containing 25% FBS. *P < .05; **P < .01 compared with control. Results are the mean ± SEM of 3 observations in 1 experiment.
Figure 4
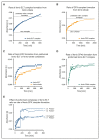
Figure 4. Rates of iron chelation and exchange between ELT and DFX in vitro.
The rates of ferric–chelate complex formation from preformed ferric–citrate complexes (iron: citrate 10:100 μM) are shown with either (A) ELT (30 μM), monitored at 614 nm, which forms a secondary peak of ELT-Fe complex, or (B) DFX (30 μM), monitored at 556 nm, secondary peak for DFX-iron complex. The top horizontal line represents 100% iron complex formation of ELT or DFX (10 μM iron[III]). The lower horizontal lines represent the absorbances of the iron-free ligands (30 μM). It can be seen that ELT binds iron from ferric citrate complexes faster than DFX. The 50% effect is achieved at about 180 min for ELT, but later at around 300 min for DFX. The 100% effect is achieved by ELT at about 12 hours, whereas DFX takes approximately 33 hours. (C) The rates of ferric–DFX complex formation (300 μM of DFX) from either preformed ferric–citrate (iron:citrate 10:100 μM) or from ferric–ELT (10 μM, 1:2) is shown. It can be seen that DFX binds iron from preformed complexes of ELT faster than from ferric–citrate complexes (D). Rate of CP40 ferric complex formation is shown at 200 μM IBE CP40 from preformed 10 μM FeELT2. The reaction is completed at approximately 200 minutes. (E) The effect of excess ELT ratio to iron on the rate of DFX chelation from preformed iron(III):ELT complexes (ratios 1:1, 1:2, 1:3, and 1:10) and 3.33, 6.66, 10, 33.3 μM ELT, respectively) are shown. Iron complexes of DFX form more rapidly and most completely when the ratio is 1:2 and 1:3 than with ratios of 1:1. A 10-fold excess of iron-free ELT to iron retards the rate of iron donation to DFX.
Figure 5
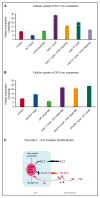
Figure 5. Cellular uptake of iron complexes of ELT, interactions with DFX and CP40, and proposed mechanisms of interaction of ELT with chelatable cellular iron and effects of second chelator.
Iron uptake into HuH7 cells from preformed chelate complexes of ELT or DFX is shown at 6 hours in (A) and (B) of the same experiment. Control iron release with ELT or CP40 (A) or DFX alone (B) are also shown. CP40 was chosen for evaluation because of its lack of iron removal from cells when used as a single agent and its lack of iron donation to cells. After incubation, cells were washed, with the first wash containing DFO at 30 μM IBE and then with 3 PBS washes before intracellular iron concentration was determined, using the ferrozine assay as described in “Materials and methods.” (A) Iron uptake from chelate complexes of ELT is shown, where complexes of ELT were presented either as 1:1 or 1:2 ratios of iron:ELT. CP40 inhibits iron uptake from both FeELT and FeELT2. (B) In contrast to CP40, DXF does not inhibit the net uptake of iron from preformed complexes of ELT. Preformed complexes of DFX (DFX2Fe) donate some iron to cells, but less than from complexes of ELT. (C) Proposed mechanisms of interaction of ELT with cellular iron with or without a second chelator. ELT diffuses into cells, rapidly binding LIP iron and thus decreasing ROS. Iron complexes of ELT then diffuse out of the cell, some of which can subsequently donate iron back to the cell (however establishing a net deironing effect of ELT monotherapy) (A). Diffusion of ELT into cells was not measured directly but has been previously shown in other cells and is consistent with its low molecular weight, its high lipid solubility, and rapid intracellular ROS inhibition. A second chelator (L) can increase intracellular iron chelation, and thus cellular iron release, if it gains direct access to LIP, as is known to occur with DFX, but not with CP40. ELT binds chelatable iron (from citrate) faster than DFX (Figure 4A-B). DFX binds iron from complexes of ELT faster than those bound to citrate (Fe:citrate 10:100) (Figure 4C). A second chelator can also increase net iron release extracellularly by competitive removal of iron from ELT–iron complexes, thus decreasing the donation of iron from ELT–iron complexes to cells. Both intracellular and extracellular donation of iron to a second chelator (L) potentially frees up ELT for a further round of iron chelation.

References

    1. Williams DD, Peng B, Bailey CK, et al. Effects of food and antacids on the pharmacokinetics of eltrombopag in healthy adult subjects: two single-dose, open-label, randomized-sequence, crossover studies. Clin Ther. 2009;31(4):764–776. - PubMed
    1. Wire MB, Bruce J, Gauvin J, et al. A randomized, open-label, 5-period, balanced crossover study to evaluate the relative bioavailability of eltrombopag powder for oral suspension (PfOS) and tablet formulations and the effect of a high-calcium meal on eltrombopag pharmacokinetics when administered with or 2 hours before or after PfOS. Clin Ther. 2012;34(3):699–709. - PubMed
    1. Roth M, Will B, Simkin G, et al. Eltrombopag inhibits the proliferation of leukemia cells via reduction of intracellular iron and induction of differentiation. Blood. 2012;120(2):386–394. - PMC - PubMed
    1. Kalota A, Selak MA, Garcia-Cid LA, Carroll M. Eltrombopag modulates reactive oxygen species and decreases acute myeloid leukemia cell survival. PLoS One. 2015;10(4):e0126691. - PMC - PubMed
    1. Kurokawa T, Murata S, Zheng YW, et al. The Eltrombopag antitumor effect on hepatocellular carcinoma. Int J Oncol. 2015;47(5):1696–1702. - PMC - PubMed

MeSH terms