. 2017 Sep 1;8(1):403.
doi: 10.1038/s41467-017-00500-z.

Hepcidin is regulated by promoter-associated histone acetylation and HDAC3

Affiliations

Hepcidin is regulated by promoter-associated histone acetylation and HDAC3

Sant-Rayn Pasricha et al. Nat Commun. .

Abstract

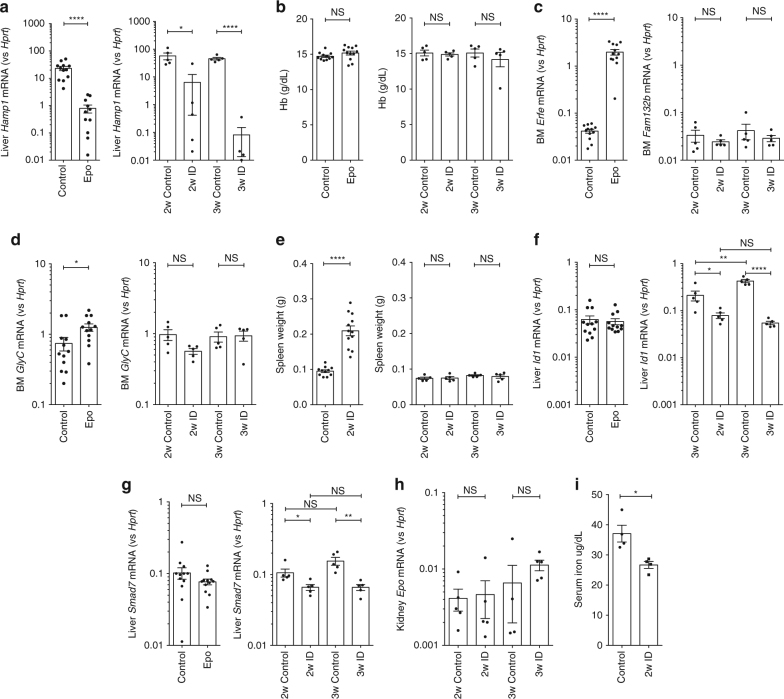
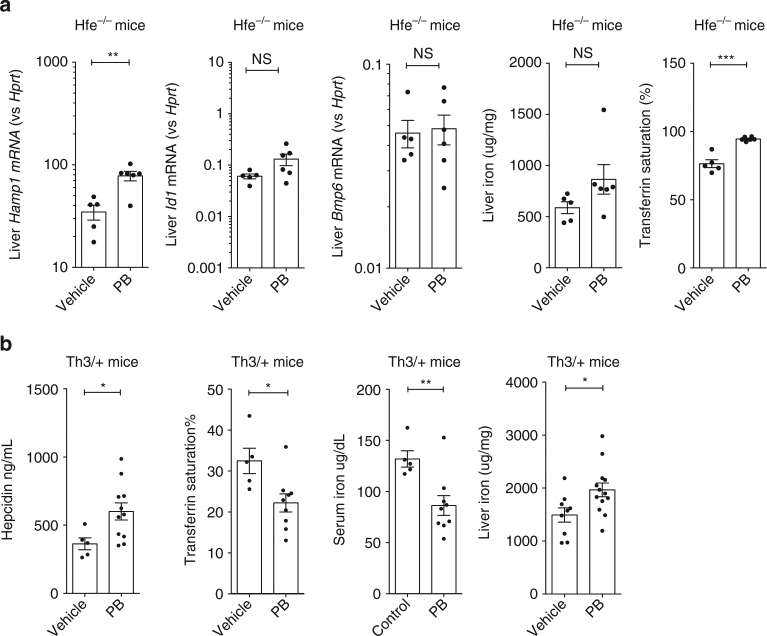
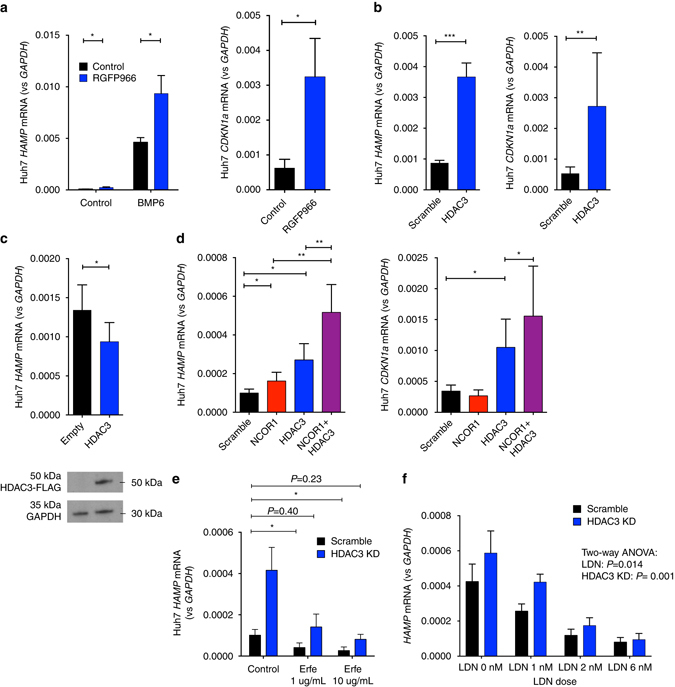
Hepcidin regulates systemic iron homeostasis. Suppression of hepcidin expression occurs physiologically in iron deficiency and increased erythropoiesis but is pathologic in thalassemia and hemochromatosis. Here we show that epigenetic events govern hepcidin expression. Erythropoiesis and iron deficiency suppress hepcidin via erythroferrone-dependent and -independent mechanisms, respectively, in vivo, but both involve reversible loss of H3K9ac and H3K4me3 at the hepcidin locus. In vitro, pan-histone deacetylase inhibition elevates hepcidin expression, and in vivo maintains H3K9ac at hepcidin-associated chromatin and abrogates hepcidin suppression by erythropoietin, iron deficiency, thalassemia, and hemochromatosis. Histone deacetylase 3 and its cofactor NCOR1 regulate hepcidin; histone deacetylase 3 binds chromatin at the hepcidin locus, and histone deacetylase 3 knockdown counteracts hepcidin suppression induced either by erythroferrone or by inhibiting bone morphogenetic protein signaling. In iron deficient mice, the histone deacetylase 3 inhibitor RGFP966 increases hepcidin, and RNA sequencing confirms hepcidin is one of the genes most differentially regulated by this drug in vivo. We conclude that suppression of hepcidin expression involves epigenetic regulation by histone deacetylase 3.Hepcidin controls systemic iron levels by inhibiting intestinal iron absorption and iron recycling. Here, Pasricha et al. demonstrate that the hepcidin-chromatin locus displays HDAC3-mediated reversible epigenetic modifications during both erythropoiesis and iron deficiency.


Conflict of interest statement

Professor Drakesmith declares research funding from Pfizer and consultancy with Kymab. Professor Draper declares research funding from Pfizer. Professor Rivella declares consultancies for Novartis and Ionis. Professor Milne is a shareholder of Oxstem Oncology (OSO), a subsidiary company of OxStem Ltd. The remaining authors declare no competing financial interests.

Figures

Fig. 1
Fig. 1
Effects of erythropoietin and iron deficiency in vivo. Effects of (1) 3 days erythropoietin (Epo) 200 IU i.p. administration and (2) 2 or 3 –weeks of iron-deficient (2–6 ppm) diet in C57Bl/6 mice, on a hepatic Hamp1 gene expression, b hemoglobin concentration, c bone marrow Fam132b gene expression, d bone marrow glycophorin C, e spleen weight, f hepatic Id1 gene expression, g hepatic Smad7 gene expression. Effects of 2 weeks iron-deficient diet on h renal Epo gene expression, and i serum iron. (Epo experiment n = 13 per group, 6-week-old males; iron deficiency (ID) experiments n = 5 per group, 4-week-old males at commencement of experimental diet). Student’s t-test. Data are means ±  s.e.m. *P ≤ 0.05; **P ≤ 0.01; ***P ≤ 0.001; ****P ≤ 0.0001; NS, P > 0.05
Fig. 2
Fig. 2
Effects of ID in Fam132b knockout mice. Effects of 3-week iron-deficient diet compared with control diet in 5-week-old wild-type and Fam132b knockout mice, on a liver iron content, b hepatic Hamp1 mRNA expression, c hepatic Bmp6 mRNA expression, d hepatic Id1 mRNA expression, e hepatic Smad7 mRNA expression, and f hepatic Atoh8 mRNA expression (WT mice, N = 4 per group. KO mice, N = 8 per group). Student’s t-test. Data are means ±  s.e.m. *P ≤ 0.05; **P ≤ 0.01; ***P ≤ 0.001; ****P ≤ 0.0001; NS, P > 0.05
Fig. 3
Fig. 3
Chromatin modifications at the hepcidin locus. a Diagram of hepcidin gene from UCSC genome browser, demonstrating ENCODE tracks for hepatic histone marks, DNase hypersensitivity (DNase-seq), and RNA expression (RNA-seq) in context and at the Hamp1 gene and promoter, and demonstrating location of amplified regions (−600 bp, −500 bp, −400 bp, −300 bp, −200 bp, exon1, intron1, exon2, exon3) used for subsequent qPCR analysis of ChIP experiments. b Six-to-eight-week-old C57Bl/6 male mice were administered Epo daily for 3 days 200 IU i.p. ChIP for regions of the Hamp1 gene promoter and body with analysis using qPCR for enrichment compared with input, for H3K9ac and H3K4me3 normalized to the % input detected at the promoter of Hprt1 (%input/ %input) and RNA pol II, and H3K27me3, n = 3 per condition. c Effects of four doses 200 IU Epo administration on expression of Hamp1 6 weeks post administration (n = 8 per condition). ChIP-qPCR demonstrating effects on histone activation marks H3k9ac (n = 3) or H3k4me3 (n = 4) at the hepcidin promoter 6 weeks following four doses 200 IU Epo administration to mice. d Six-week-old C57BL/6 male mice were given an iron-deficient diet for 2 weeks or a matched control diet. ChIP for H3K9ac and H3K4me3, normalized to Hprt. e Huh7 cells treated with either 24 h 18 nM BMP6, 500 nM LDN153189, or control. ChIP for H3K9ac at the HAMP locus, normalized to GAPDH locus. N = 3 biologic replicates. Epo erythropoietin, ID iron-deficient diet. Student unpaired t-test (mouse data), paired t-test (Huh7 cell data), bars are mean ± s.e.m. Data are means ± s.e.m. *P ≤ 0.05; **P ≤ 0.01; ***P ≤ 0.001; ****P ≤ 0.0001; NS, P > 0.05
Fig. 4
Fig. 4
Effects of Epo treatment or ID with PB co-administration. six- to eight-week-old C57Bl/6 male mice were treated with 200 IU Epo per day for 3 days with or without Panobinostat 0.4 mg (20 mg/kg) (ac). a ChIP-qPCR data for hepatic H3K9ac and H3K4me3 at the Hamp1 locus, and b hepatic Hamp1 mRNA expression, bone marrow Fam132b mRNA expression, and hepatic Id1 mRNA expression. For a, N = 3–4 per group. For b N = 12 per group. (Three identical experiments comprising four mice per group were performed, and are presented here as combined data.) c Effects of Epo and PB on erythropoiesis. Examples of flow scatterplots of CD71 vs Ter119 from cells isolated from spleens from mice treated with each condition (Control, Epo, PB, Epo + PB) are shown, together with a summary of the effects of each condition on erythroblast maturation, with specific comparison of intermediate erythroblasts between groups (n = 4 per group). df Six-week-old C57Bl/6 male mice were given an iron-deficient diet for 2 weeks with or without Panobinostat 0.4 mg (20 mg/kg) for the last 7 days. Effects on c H3K9ac (N = 3 per group) and H3K4me3 (N = 2 per group), d hepatic Hamp1 mRNA expression, bone marrow Fam132b mRNA expression, and hepatic Id1 mRNA expression. (For d, N = 3–4 per group. For e N = 12 per group—three identical experiments comprising four mice per group were performed, and presented as combined data.) f Effects of ID and PB on erythropoiesis. Student’s t-test. Animals in this experiment are partially included in the Epo vs control data presented in Fig. 1. Epo erythropoietin, ID iron-deficient diet, PB panobinostat. Data are means ± s.e.m. *P ≤ 0.05; **P ≤ 0.01; ***P ≤ 0.001; ****P ≤ 0.0001; NS, P > 0.05
Fig. 5
Fig. 5
Effects of Panobinostat on hepcidin in disease models of iron overload. a Effects of 3 days 20 mg/kg/d i.p. PB vs control on 15-week-old HFE−/− on liver Hamp1 mRNA, Id1 mRNA, and Bmp6 mRNA expression; liver non-heme iron content, and transferrin saturation. b Effects of Panobinostat 5 mg/kg/d for 7 days on 8–24-week-old HbbTh3/+ (Th3/+) mice on serum hepcidin levels, transferrin saturation, serum iron, and liver non-heme iron concentrations. Student’s t-test. Data are means ±  s.e.m. *P ≤ 0.05; **P ≤ 0.01; ***P ≤ 0.001; ****P ≤ 0.0001; NS, P > 0.05
Fig. 6
Fig. 6
In vitro effects of PB on HAMP expression in liver-derived cells. a Effect of Panobinostat 10 and 100 nM on BMP9- (0, 10, and 50 ng/ml) induced Hamp1 expression (relative to Hprt) in mouse precision cut liver slices. Data are normalized to baseline (untreated cells). N = 3 separate experiments. Two-way ANOVA by BMP9 dose and PB treatment. b Effect of Panobinostat 10 nM and BMP6 (0, 6, and 18 nM) on HAMP expression (relative to GAPDH) in HuH7 human hepatoma cells. Data are normalized to baseline for each condition. N = 3 separate experiments. Two-way ANOVA by BMP6 dose and PB treatment. c Effects of PB treatment vs DMSO on HAMP, ID1, SMAD7, and ATOH8 mRNA expression in Huh7 cells, n = 3 separate experiments (same experiment as BMP6 0 nM condition from b. d Effect on HAMP and ID1 mRNA of treatment with isoform-specific HDAC inhibitors in Huh7 cells. HDAC(s) targeted by each inhibitor presented in the text. N = 3 separate experiments. One-way ANOVA, t-test for comparison between RGFP966 and control. e Whole-cell H3K9ac in Huh7 cells treated with RGFP966 and PB. f Depiction of HAMP promoter luciferase activity from knockdown of each HDAC isoform in a previously published RNAi screen (two replicates per HDAC). g Validation of HDAC3 and HDAC10 knockdown effects on HAMP mRNA expression in Huh7 cells (n = 3 separate experiments, paired t-test). Data are means ± s.e.m. *P ≤ 0.05; **P ≤ 0.01; ***P ≤ 0.001; ****P ≤ 0.0001; NS, P > 0.05
Fig. 7
Fig. 7
Effects of HDAC3 inhibition on hepcidin expression. Effects of treatment of Huh7 cells with RGFP966 10 µM on a HAMP (n = 6 separate experiments, paired t-test) and CDKN1A mRNA expression (n = 6 separate experiments, paired t-test). b Effect of knockdown of HDAC3 (using 100 nM siRNA) on HAMP and CDKN1A mRNA expression (n = 6 separate experiments, paired t-test). c Effects of overexpression of HDAC3 on HAMP mRNA expression (n = 5 separate experiments, paired t-test). Western blot for FLAG at 50 kDA (molecular weight of HDAC3). d Effects of single knockdown of HDAC3 and NCOR1 (using 50 nM siRNA) or double knockdown of HDAC3 + NCOR1 (50 nM each) on HAMP1 and CDKN1A mRNA expression, n = 6 replicates, ratio paired t-tests. e Effects of erythroferrone treatment in Huh7 cells with and without concurrent HDAC3 knockdown on HAMP mRNA expression, n = 3 separate experiments, comparing scramble + vehicle with HDAC3 knockdown + Erfe (1 or 10 µg/ml) (two-way ANOVA for effects of HDAC3 and Erfe, paired t-tests for specific comparisons of interest). f Effects in Huh7 cells of LDN titrations (control, 1, 2, and 6 nM) with and without concurrent HDAC3 knockdown on HAMP mRNA expression, n = 6 separate experiments, two-way ANOVA for effects of LDN and HDAC3. Data are means ±  s.e.m. *P ≤ 0.05; **P ≤ 0.01; ***P ≤ 0.001; ****P ≤ 0.0001; NS, P > 0.05
Fig. 8
Fig. 8
Effects of HDAC3 inhibition in vivo on hepcidin expression in iron-deficient mice. Four-week-old C57Bl/6 mice were fed a low-iron diet (2 ppm) for 3 weeks, followed by two doses of RGFP966 2 h apart, and killed 2 h following the second dose. Effect on hepatic a Cdkn1a, b Hamp1, c Id1, d Atoh8, e Smad7, and f Bmp6 mRNA expression, g liver iron. h Western blot for hepatic ferroportin expression. i Effect of RGFP966 on spleen iron. N = 6 per group. Data are means ± s.e.m. *P ≤ 0.05; **P ≤ 0.01; ***P ≤ 0.001; ****P ≤ 0.0001; NS, P > 0.05
Fig. 9
Fig. 9
Enrichment of HDAC3 at the hepcidin locus and effects of HDAC3 inhibition on genome-wide RNA expression profile. a Six-week-old C57Bl/6 male mice were administered Epo daily for 3 days 200 IU i.p. or control. ChIP-qPCR for HDAC3 (compared with IgG isotype control) at the hepcidin gene locus, along with the Cdkn1a locus as a positive control and a negative control genomic region. N = 3, paired t-tests. RNA sequencing of livers from mice treated with 3 weeks low-iron diet followed by either vehicle or two doses of RGFP966. Three biologic samples (those with the highest quality RNA) were selected for sequencing from each group. b Smear plot (log fold change vs expression levels), highlighting Hamp and Cdkn1a genes. c Volcano plot (P-value vs log fold change) highlighting Hamp and Cdkn1a genes. d HDAC3 ChIP-Seq peaks were annotated and compared to differentially expressed genes. Expression of each HDAC in 6-week-old mice treated with e Epo vs control, and f ID vs control. Significance testing adjusted for multiple comparisons. N = 8 per group, same mice as experiments presented in Fig. 4

References

    1. Ganz T. Systemic iron homeostasis. Physiol. Rev. 2013;93:1721–1741. doi: 10.1152/physrev.00008.2013. - DOI - PubMed
    1. Steinbicker AU, Muckenthaler MU. Out of balance--systemic iron homeostasis in iron-related disorders. Nutrients. 2013;5:3034–3061. doi: 10.3390/nu5083034. - DOI - PMC - PubMed
    1. Ramos E, et al. Evidence for distinct pathways of hepcidin regulation by acute and chronic iron loading in mice. Hepatology. 2011;53:1333–1341. doi: 10.1002/hep.24178. - DOI - PMC - PubMed
    1. Meynard D, et al. Lack of the bone morphogenetic protein BMP6 induces massive iron overload. Nat. Genet. 2009;41:478–481. doi: 10.1038/ng.320. - DOI - PubMed
    1. Andriopoulos B, Jr., et al. BMP6 is a key endogenous regulator of hepcidin expression and iron metabolism. Nat. Genet. 2009;41:482–487. doi: 10.1038/ng.335. - DOI - PMC - PubMed

Publication types