Inhibition of IL-6-JAK/Stat3 signaling in castration-resistant prostate cancer cells enhances the NK cell-mediated cytotoxicity via alteration of PD-L1/NKG2D ligand levels
- PMID: 28865178
- PMCID: PMC5830627
- DOI: 10.1002/1878-0261.12135
Inhibition of IL-6-JAK/Stat3 signaling in castration-resistant prostate cancer cells enhances the NK cell-mediated cytotoxicity via alteration of PD-L1/NKG2D ligand levels
Abstract
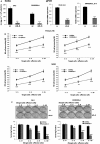
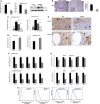
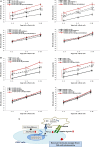
To investigate whether IL-6 signaling affects the susceptibility of castration-resistant prostate cancer (CRPC) cells to cytotoxic action of natural killer (NK) cells, CRPC cell lines (having different IL-6 levels) were developed by lentiviral transduction. While observing no secreted IL-6 level in parental C4-2 and CWR22Rv1 cells, we found the IL-6 expression/secretion in these cells was induced after the transduction process and the IL-6 level difference in C4-2siIL-6/sc and CWR22siIL-6/sc cell CRPC cell sets could be detected. We then found that IL-6-knockdown cells were more susceptible to NK cell cytotoxicity than control cells due to lowered programmed death receptor ligand 1 (PD-L1) and increased NK group 2D (NKG2D) ligand levels. In animal studies, to concur with the in vitro results, we found that IL-6-expressing cell-derived tumors were more resistant to NK cell action than the tumors of IL-6-knockdown cells. Further, we discovered that JAK-Stat3 is the most critical IL-6 downstream signaling that modulates PD-L1/NKG2D ligand levels in CRPC cells. Furthermore, inhibition of the JAK or Stat3 signaling effectively increased the susceptibility of C4-2sc and CWRsc cells to NK cell cytotoxicity. We observed the most effective cytotoxicity when the PD-L1 Ab and JAK inhibitor (or Stat 3 inhibitor) were used together. These results suggest that the strategy of targeting IL-6 signaling (or its downstream signaling) may enhance the NK cell-mediated immune action to CRPC tumors, thus yielding clinical implications in developing future immunotherapeutics of exploiting this strategy to treat patients with CRPC.
Keywords: IL-6; JAK; NK cell cytotoxicity; NKG2D; Stat3; castration-resistant prostate cancer; programmed death receptor ligand 1.
© 2017 The Authors. Published by FEBS Press and John Wiley & Sons Ltd.
Figures


Similar articles
-
Adipocytes affect castration-resistant prostate cancer cells to develop the resistance to cytotoxic action of NK cells with alterations of PD-L1/NKG2D ligand levels in tumor cells.Prostate. 2018 Apr;78(5):353-364. doi: 10.1002/pros.23479. Epub 2018 Jan 12. Prostate. 2018. PMID: 29330929
-
In vitro-induced M2 type macrophages induces the resistance of prostate cancer cells to cytotoxic action of NK cells.Exp Cell Res. 2018 Mar 1;364(1):113-123. doi: 10.1016/j.yexcr.2018.01.041. Epub 2018 Feb 1. Exp Cell Res. 2018. PMID: 29408565
-
Combined inhibition of JAK1,2/Stat3‑PD‑L1 signaling pathway suppresses the immune escape of castration‑resistant prostate cancer to NK cells in hypoxia.Mol Med Rep. 2018 Jun;17(6):8111-8120. doi: 10.3892/mmr.2018.8905. Epub 2018 Apr 20. Mol Med Rep. 2018. PMID: 29693186 Free PMC article.
-
The IL-6/JAK/STAT3 pathway: potential therapeutic strategies in treating colorectal cancer (Review).Int J Oncol. 2014 Apr;44(4):1032-40. doi: 10.3892/ijo.2014.2259. Epub 2014 Jan 15. Int J Oncol. 2014. PMID: 24430672 Review.
-
What Do We Have to Know about PD-L1 Expression in Prostate Cancer? A Systematic Literature Review. Part 3: PD-L1, Intracellular Signaling Pathways and Tumor Microenvironment.Int J Mol Sci. 2021 Nov 15;22(22):12330. doi: 10.3390/ijms222212330. Int J Mol Sci. 2021. PMID: 34830209 Free PMC article.
Cited by
-
Involvement of extracellular vesicles in the macrophage-tumor cell communication in head and neck squamous cell carcinoma.PLoS One. 2019 Nov 7;14(11):e0224710. doi: 10.1371/journal.pone.0224710. eCollection 2019. PLoS One. 2019. PMID: 31697737 Free PMC article.
-
Emerging phagocytosis checkpoints in cancer immunotherapy.Signal Transduct Target Ther. 2023 Mar 7;8(1):104. doi: 10.1038/s41392-023-01365-z. Signal Transduct Target Ther. 2023. PMID: 36882399 Free PMC article. Review.
-
HIF1α-dependent and independent pathways regulate the expression of PD-L1 in prostate cancer.Med Oncol. 2023 Apr 17;40(5):151. doi: 10.1007/s12032-023-02017-6. Med Oncol. 2023. PMID: 37067635 Free PMC article.
-
CAR-NK Cells in the Treatment of Solid Tumors.Int J Mol Sci. 2021 May 31;22(11):5899. doi: 10.3390/ijms22115899. Int J Mol Sci. 2021. PMID: 34072732 Free PMC article. Review.
-
ZNF652-Induced circRHOT1 Promotes SMAD5 Expression to Modulate Tumorigenic Properties and Nature Killer Cell-Mediated Toxicity in Bladder Cancer via Targeting miR-3666.J Immunol Res. 2021 Dec 9;2021:7608178. doi: 10.1155/2021/7608178. eCollection 2021. J Immunol Res. 2021. PMID: 34926705 Free PMC article.
References
-
- Afreen S and Dermime S (2014) The immunoinhibitory B7‐H1 molecule as a potential target in cancer: killing many birds with one stone. Hematol Oncol Stem Cell Ther 7, 1–17. - PubMed
-
- Bae DS, Hwang YK and Lee JK (2012) Importance of NKG2D‐NKG2D ligands interaction for cytolytic activity of natural killer cell. Cell Immunol 276, 122–127. - PubMed
Publication types
MeSH terms
Substances
Grants and funding
LinkOut - more resources
Full Text Sources
Other Literature Sources
Research Materials
Miscellaneous

