. 2017 Oct;19(10):781-790.
doi: 10.1016/j.neo.2017.06.005. Epub 2017 Aug 30.

Misidentified Human Gene Functions with Mouse Models: The Case of the Retinoblastoma Gene Family in Senescence

Affiliations

Misidentified Human Gene Functions with Mouse Models: The Case of the Retinoblastoma Gene Family in Senescence

Nicola Alessio et al. Neoplasia. 2017 Oct.

Abstract

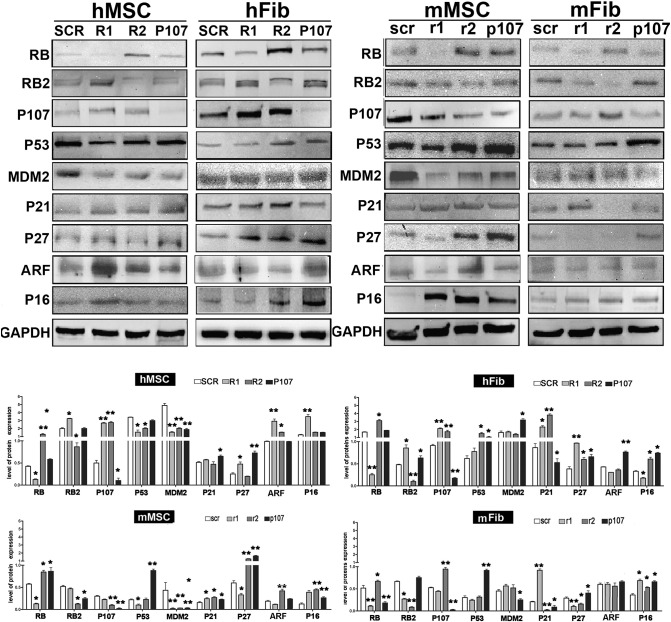
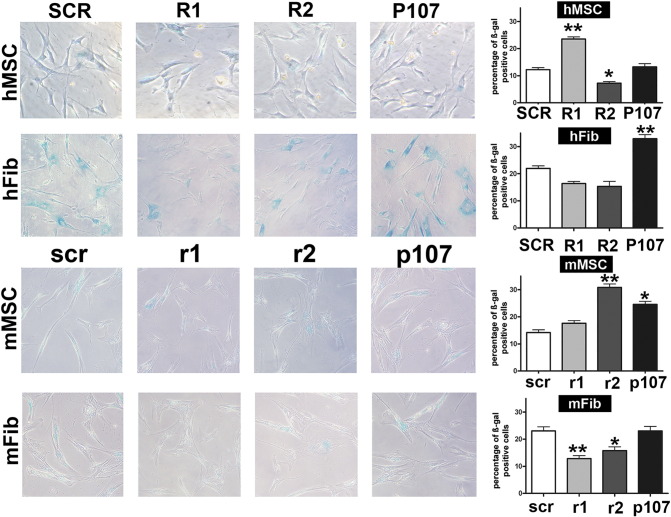
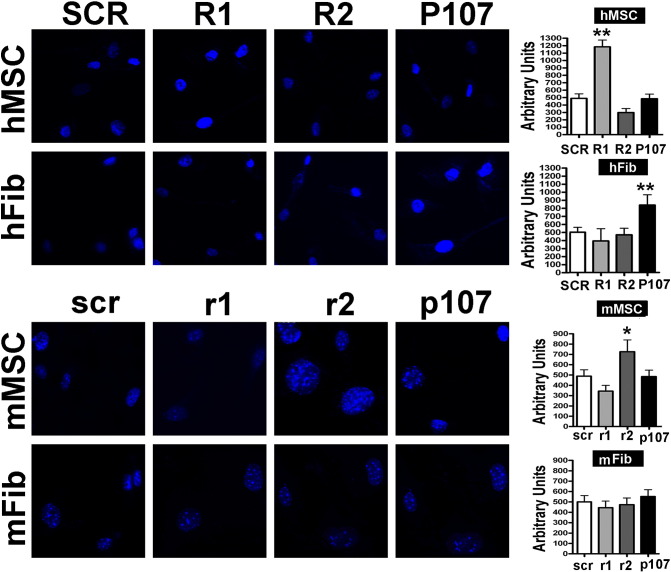
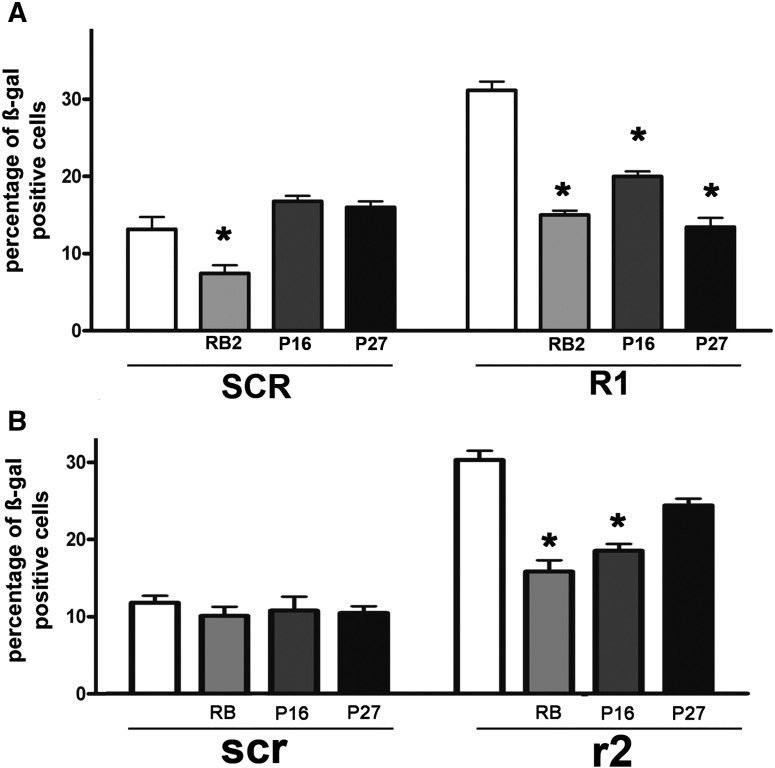
Although mice models rank among the most widely used tools for understanding human genetics, biology, and diseases, differences between orthologous genes among species as close as mammals are possible, particularly in orthologous gene pairs in which one or more paralogous (i.e., duplicated) genes appear in the genomes of the species. Duplicated genes can possess overlapping functions and compensate for each other. The retinoblastoma gene family demonstrates typical composite functionality in its three member genes (i.e., RB1, RB2/P130, and P107), all of which participate in controlling the cell cycle and associated phenomena, including proliferation, quiescence, apoptosis, senescence, and cell differentiation. We analyzed the role of the retinoblastoma gene family in regulating senescence in mice and humans. Silencing experiments with each member of the gene family in mesenchymal stromal cells (MSCs) and fibroblasts from mouse and human tissues demonstrated that RB1 may be indispensable for senescence in mouse cells, but not in human ones, as an example of species specificity. Furthermore, although RB2/P130 seems to be implicated in maintaining human cell senescence, the function of RB1 within any given species might differ by cell type, as an example of cell specificity. For instance, silencing RB1 in mouse fibroblasts induced a reduced senescence not observed in mouse MSCs. Our findings could be useful as a general paradigm of cautions to take when inferring the role of human genes analyzed in animal studies and when examining the role of the retinoblastoma gene family in detail.


Figures

Figure 1
Figure 1
Western blot analysis following silencing experiments. RB1, RB2/P130, and P107 were silenced in human and mouse cells with specific shRNAs. The panel shows the expression levels of several proteins following treatments of cells with shRNAs. GAPDH protein was used as loading control. R1, R2, and P107 stand for shRNAs against human RB1, RB2/P130, and P107 mRNAs, respectively. The control shRNA with a scrambled sequence was named SCR. Silencing experiments were carried out in human MSCs (hMSC) and fibroblasts (hFib). Mouse MSCs (mMSC) and fibroblasts (mFib) were treated with shRNAs that specifically targeted mouse mRNAs of RB1, RB2/P130, and P107 (r1, r2, and p107, respectively). Control shRNAs for mouse cells was named scr. The histogram shows the quantitative evaluation of Western blot bands. For every experimental condition, the mean expression values (±SD, n = 3) are indicated. The expression levels of the indicated proteins were evaluated in RB1- or RB2/P130- or P107-silenced cells and were compared with those of cells treated with control shRNAs (*P < .05; **P < .01).
Figure 2
Figure 2
(A) Senescence levels in cells with silenced retinoblastoma proteins. The presence of senescent cells was evaluated in human and mouse cells following the silencing of RB1, RB2/P130, and P107 with specific shRNAs. The picture shows representative microscopic fields of senescence-associated beta-galactosidase–positive cells in the different experimental conditions. The histograms show the percentage of senescent cells in MSCs and fibroblasts from both human and mouse origin (hMSC, mMSC, hFib, and mFib, respectively). R1, R2m and P107 stand for shRNAs against human RB1, RB2/P130, and P107 mRNAs, respectively. The control shRNA with a scrambled sequence was named SCR. The shRNAs against the corresponding mouse mRNAs were indicated as r1, r2, and p107, respectively. Control shRNAs for mouse cells was named scr. Data are expressed with standard deviation (n = 3, *P < .05, **P < .01). (B) DAPI staining. Fluorescence photomicrographs show cells stained with DAPI (blue). Representative microscopic fields are shown. The graph shows the degree of DAPI staining. For each positive cell, the DAPI intensity was acquired with a CCD camera and analyzed with Quantity One 1-D analysis software (Bio-Rad Laboratories). We calculated the sum of the fluorescent pixel values of DAPI-positive cells and then determined the average fluorescent pixel intensity, which was expressed in arbitrary units. For every experimental condition, staining intensity was determined for 200 cells. Data are expressed with standard deviation (n = 3, *P < .05, **P < .01).
Figure 2
Figure 2
(A) Senescence levels in cells with silenced retinoblastoma proteins. The presence of senescent cells was evaluated in human and mouse cells following the silencing of RB1, RB2/P130, and P107 with specific shRNAs. The picture shows representative microscopic fields of senescence-associated beta-galactosidase–positive cells in the different experimental conditions. The histograms show the percentage of senescent cells in MSCs and fibroblasts from both human and mouse origin (hMSC, mMSC, hFib, and mFib, respectively). R1, R2m and P107 stand for shRNAs against human RB1, RB2/P130, and P107 mRNAs, respectively. The control shRNA with a scrambled sequence was named SCR. The shRNAs against the corresponding mouse mRNAs were indicated as r1, r2, and p107, respectively. Control shRNAs for mouse cells was named scr. Data are expressed with standard deviation (n = 3, *P < .05, **P < .01). (B) DAPI staining. Fluorescence photomicrographs show cells stained with DAPI (blue). Representative microscopic fields are shown. The graph shows the degree of DAPI staining. For each positive cell, the DAPI intensity was acquired with a CCD camera and analyzed with Quantity One 1-D analysis software (Bio-Rad Laboratories). We calculated the sum of the fluorescent pixel values of DAPI-positive cells and then determined the average fluorescent pixel intensity, which was expressed in arbitrary units. For every experimental condition, staining intensity was determined for 200 cells. Data are expressed with standard deviation (n = 3, *P < .05, **P < .01).
Figure 3
Figure 3
Identification of senescence-associated pathways in human and mouse cells. (A) The histogram shows the percentage of senescent cells following treatment with siRNAs against RB2/P130 or P27 or P16 in human MSCs having silenced RB1 (R1) or in control sample (SCR). (B) The histogram shows the percentage of senescent cells following treatment with siRNAs against RB1 or P27 or P16 in mouse MSCs having silenced RB2/P130 (r2) or in control sample (scr). Data are expressed with standard deviation (n = 3, *P < .05).
Figure 4
Figure 4
Follow-up of acute senescence in human and mouse cells. Human MSCs and mouse fibroblasts were treated with peroxide hydrogen to induce senescence. We collected cells and performed immunocytochemistry to evaluate RB1 and RB2/P130 expression 3 and 24 hours following stressor treatment. The two time points were indicated as early and late phase of senescence. (A) Fluorescence photomicrographs show the merging of cells stained with anti-RPS6 (green), anti–Ki-67 (red), and RB1 (blue) in human MSCs during early and late senescence. Light microscopy pictures show the same fields stained to detect senescence-associated beta-galactosidase. In early senescence, the arrow indicates a senescent cell that is Ki67(+) and RB1(+). In late senescence, the arrows indicate a senescent cell that is negative for Ki67 and RB1. RPS6 stands for 40S ribosomal protein S6 and was used to detect cells. (B) Photomicrographs show the merging of cells stained with anti-RPS6 (green), anti–Ki-67 (red), and RB2 (blue) in human MSCs during early and late senescence. Light microscopy pictures show the same fields stained to detect senescence-associated beta-galactosidase. In early phase, the arrow indicates a senescent cell that is Ki67(+) and RB2(−). In late senescence, the arrows indicate a senescent cell that is Ki67(−) and RB2 (+). (C and D) Experiments carried out in mouse fibroblasts. The panels show the same staining we reported in panels A and B, respectively. In panel C (early), the arrow indicates a senescent cell that is positive for Ki67 and RB1. In late phase, the cells become Ki67(−) but remained RB1 positive (see arrow). In panel D (early), the cells are Ki67 (+) and RB2 (−). In the late phase, cells were Ki67(−) and became RB2 (+) (See the arrows).

References

    1. Gharib WH, Robinson-Rechavi M. When orthologs diverge between human and mouse. Brief Bioinform. 2011;12:436–441. - PMC - PubMed
    1. Campisi J, d'Adda di Fagagna F. Cellular senescence: when bad things happen to good cells. Nat Rev Mol Cell Biol. 2007;8:729–740. - PubMed
    1. Classon M, Dyson N. p107 and p130: versatile proteins with interesting pockets. Exp Cell Res. 2001;264:135–147. - PubMed
    1. Galderisi U, Cipollaro M, Giordano A. The retinoblastoma gene is involved in multiple aspects of stem cell biology. Oncogene. 2006;25:5250–5256. - PubMed
    1. LeCouter JE, Kablar B, Hardy WR, Ying C, Megeney LA, May LL, Rudnicki MA. Strain-dependent myeloid hyperplasia, growth deficiency, and accelerated cell cycle in mice lacking the Rb-related p107 gene. Mol Cell Biol. 1998;18:7455–7465. - PMC - PubMed

MeSH terms

Substances