. 2017 Sep 7;101(3):369-390.
doi: 10.1016/j.ajhg.2017.07.016. Epub 2017 Aug 31.

Exonic Mosaic Mutations Contribute Risk for Autism Spectrum Disorder

Affiliations

Exonic Mosaic Mutations Contribute Risk for Autism Spectrum Disorder

Deidre R Krupp et al. Am J Hum Genet. .

Abstract

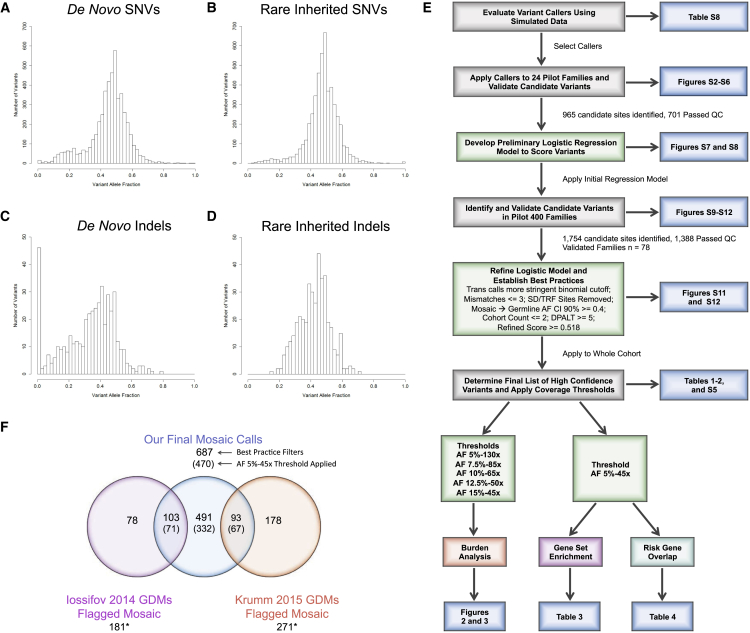
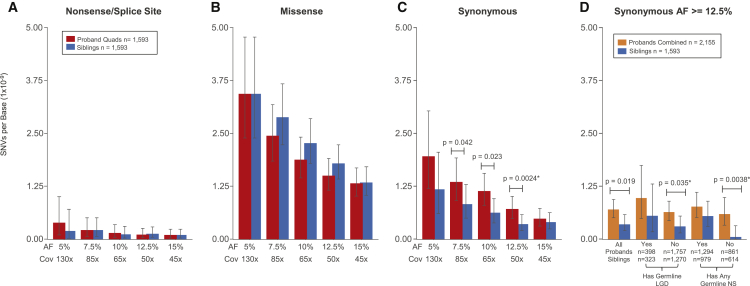
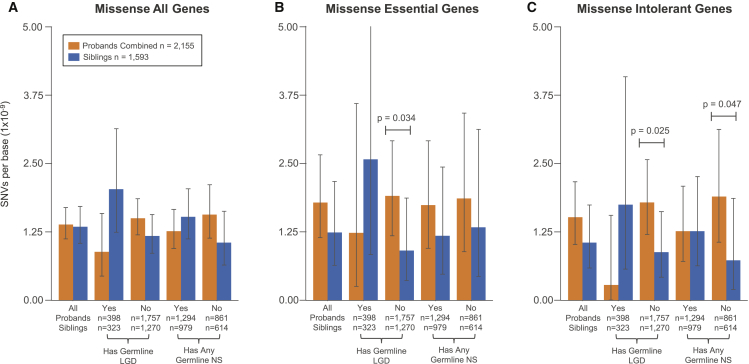
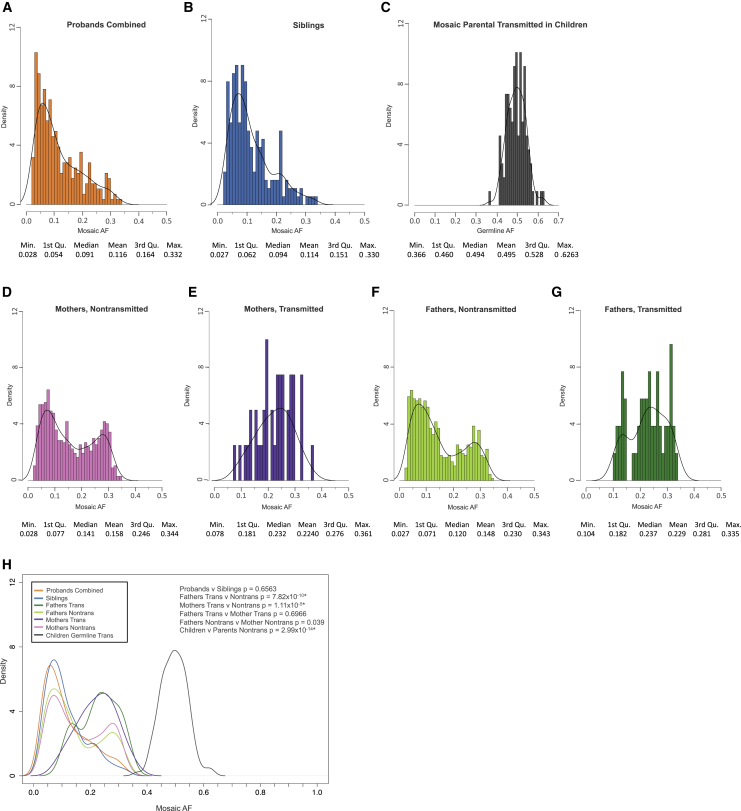
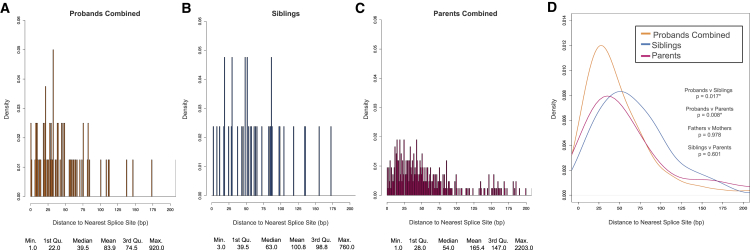
Genetic risk factors for autism spectrum disorder (ASD) have yet to be fully elucidated. Postzygotic mosaic mutations (PMMs) have been implicated in several neurodevelopmental disorders and overgrowth syndromes. By leveraging whole-exome sequencing data on a large family-based ASD cohort, the Simons Simplex Collection, we systematically evaluated the potential role of PMMs in autism risk. Initial re-evaluation of published single-nucleotide variant (SNV) de novo mutations showed evidence consistent with putative PMMs for 11% of mutations. We developed a robust and sensitive SNV PMM calling approach integrating complementary callers, logistic regression modeling, and additional heuristics. In our high-confidence call set, we identified 470 PMMs in children, increasing the proportion of mosaic SNVs to 22%. Probands have a significant burden of synonymous PMMs and these mutations are enriched for computationally predicted impacts on splicing. Evidence of increased missense PMM burden was not seen in the full cohort. However, missense burden signal increased in subcohorts of families where probands lacked nonsynonymous germline mutations, especially in genes intolerant to mutations. Parental mosaic mutations that were transmitted account for 6.8% of the presumed de novo mutations in the children. PMMs were identified in previously implicated high-confidence neurodevelopmental disorder risk genes, such as CHD2, CTNNB1, SCN2A, and SYNGAP1, as well as candidate risk genes with predicted functions in chromatin remodeling or neurodevelopment, including ACTL6B, BAZ2B, COL5A3, SSRP1, and UNC79. We estimate that PMMs potentially contribute risk to 3%-4% of simplex ASD case subjects and future studies of PMMs in ASD and related disorders are warranted.

Keywords: autism spectrum disorder; exome; mosaicism; mutation; neurodevelopment; postzygotic; somatic; splicing.


Figures

Figure 1
Figure 1
Re-Evaluation De Novo Mutations in the Simons Simplex Collection (SSC) (A–D) Histograms showing the allele fraction distributions of previously published autosomal de novo or rare inherited variants in the SSC. (A) Published de novo SNVs (n = 2,893) show an elevated number of low allele fraction calls that are potentially PMMs (left tail). (B) Representative histogram from a random sampling of 2,893 published autosomal rare inherited SNVs. The number of low allele fraction calls is substantially fewer compared to de novo SNVs (left tail). (C) Published de novo indels (n = 268) show an elevated number of low allele fraction calls (left tail) that are potentially PMMs as well as an overall shifted distribution. (D) Representative histogram from a random sampling of 268 published rare inherited indels. Similar to SNVs, the number of low allele fraction calls is substantially fewer compared to de novo indels (left tail). (E) Schematic showing an overview of our systematic approach to developing a robust PMM calling pipeline and applying it to the SSC. Key analyses and display items are indicated. Abbreviations: Trans calls, calls showing evidence of transmission from parent to child; SD/TRF, segmental duplications/tandem repeats; AF, allele fraction; CI, confidence interval; and DPALT, Q20 alternative allele depth. (F) Venn diagram showing the intersection of previously published de novo mutations initially flagged as potentially PMMs (binomial p ≤ 0.001) and our PMM calls after applying final filters. Numbers in parentheses are calls remaining after applying an AF 5%-45× joint coverage threshold. Our pipeline identified an additional 37 calls (29 from Iossifov et al. and 8 from Krumm et al.12), which overlapped the published calls flagged as potentially mosaic but were re-classified as likely germline based on their AF CIs. Note: Krumm et al. dataset only reported newly identified calls and therefore does not intersect the Iossifov et al. dataset.
Figure 2
Figure 2
Rates and Burden of SNV PMMs in the Simons Simplex Collection (SSC) (A–C) Rates and burden analyses of PMMs in quad families of the SSC. Mean rates with 95% Poisson CIs (exact method) are shown. (A) Nonsense/splice PMM rates are similar and not evaluated further given their low frequency. (B) Missense PMMs show no evidence of burden in probands from quad families. (C) Synonymous PMMs show an unexpected burden in probands from quad families. Significance determined using a two-sided Wilcoxon signed-rank test. FDR < 0.05 using the Benjamini-Yekutieli approach. (D) Analysis of synonymous PMMs at AF 12.5%-50× in the full SSC and subcohorts. Mean rates with 95% Poisson CIs (exact method) are shown for combined probands (quad + trio families) and unaffected siblings. Abbreviations are as follows: SSC subcohorts all, all families within the cohort passing quality criteria; Has Germline LGD, denotes whether or not proband in family has a LGD GDM or gene disrupting de novo CNV; Has Any Germline NS, denotes whether or not proband in family has any NS GDM (includes the LGD set). Significance determined using a two-sided Wilcoxon rank sum test. FDR < 0.05 using the Benjamini-Yekutieli approach.
Figure 3
Figure 3
Rates and Burden of Missense PMMs in Subcohorts and Gene Sets For all plots, the 15%-45× burden call set was used and mean rates with 95% Poisson CIs (exact method) are shown. Abbreviations are as follows: SSC subcohorts: All, all families within the cohort passing quality criteria; Has Germline LGD, denotes whether or not proband in family has a LGD GDM or gene disrupting de novo CNV; Has Any Germline NS, denotes whether or not proband in family has any NS GDM (includes the LGD set). Significance determined using a one-sided Wilcoxon rank sum test. No comparisons met a FDR < 0.05 using the Benjamini-Yekutieli approach. (A) Splitting by subcohort shows trends for increased missense PMM burden in families where probands do not have reported germline mutations. (B) Evaluating mutations specific for the essential gene set shows stronger proband burden in the without any germline LGD subcohort. (C) Similarly, evaluating mutations specific for the intolerant gene set shows stronger proband burden without any germline LGD or without any germline NS subcohorts.
Figure 4
Figure 4
Mosaic Variant Allele Fraction Distributions For all plots, all PMMs from the 5%-45× high-confidence call set were used. (A) Distribution of allele fractions for variants in probands combined (quad + trio families). (B) Distribution of allele fractions for variants in siblings. (C) Distribution of allele fractions for germline variants in children that were transmitted from mosaic parents. (D and E) Distribution of allele fractions for variants in mothers that were not (D) and were (E) transmitted to children. (F and G) Distribution of allele fractions for variants in fathers that were not (F) and were (G) transmitted to children. (H) Combined data plotted as kernel density curves. Parental transmitted are significantly shifted toward a higher allele fraction than nontransmitted or child mosaic variants. Children have a significantly different distribution than parental nontransmitted. Significance determined using a two-sided Wilcoxon rank sum test. FDR < 0.05 using the Benjamini-Yekutieli approach.
Figure 5
Figure 5
Distance to Nearest Splice Site for Synonymous PMMs For all plots, all synonymous PMMs from the 5%-45× high-confidence call set were used. Splice site distances were calculated as absolute minimum distance to nearest canonical splice site. (A) Distribution of distance to nearest splice site in probands combined (quad + trio families). (B) Distribution of distance to nearest splice site in siblings. (C) Distribution of distance to nearest splice site in combined parents (quad + trio families). (D) Combined data plotted as kernel density curves. Proband distribution is significantly shifted toward the canonical splice sites compared to both parents and siblings. Significance was determined using a two-sided Wilcoxon rank sum test. FDR < 0.05 using the Benjamini-Yekutieli approach.

References

    1. O’Roak B.J., Deriziotis P., Lee C., Vives L., Schwartz J.J., Girirajan S., Karakoc E., Mackenzie A.P., Ng S.B., Baker C. Exome sequencing in sporadic autism spectrum disorders identifies severe de novo mutations. Nat. Genet. 2011;43:585–589. - PMC - PubMed
    1. O’Roak B.J., Vives L., Girirajan S., Karakoc E., Krumm N., Coe B.P., Levy R., Ko A., Lee C., Smith J.D. Sporadic autism exomes reveal a highly interconnected protein network of de novo mutations. Nature. 2012;485:246–250. - PMC - PubMed
    1. Neale B.M., Kou Y., Liu L., Ma’ayan A., Samocha K.E., Sabo A., Lin C.F., Stevens C., Wang L.S., Makarov V. Patterns and rates of exonic de novo mutations in autism spectrum disorders. Nature. 2012;485:242–245. - PMC - PubMed
    1. Sanders S.J., Murtha M.T., Gupta A.R., Murdoch J.D., Raubeson M.J., Willsey A.J., Ercan-Sencicek A.G., DiLullo N.M., Parikshak N.N., Stein J.L. De novo mutations revealed by whole-exome sequencing are strongly associated with autism. Nature. 2012;485:237–241. - PMC - PubMed
    1. Iossifov I., Ronemus M., Levy D., Wang Z., Hakker I., Rosenbaum J., Yamrom B., Lee Y.H., Narzisi G., Leotta A. De novo gene disruptions in children on the autistic spectrum. Neuron. 2012;74:285–299. - PMC - PubMed