. 2017 Sep 21;67(6):1013-1025.e9.
doi: 10.1016/j.molcel.2017.07.028. Epub 2017 Aug 31.

Global Inhibition with Specific Activation: How p53 and MYC Redistribute the Transcriptome in the DNA Double-Strand Break Response

Affiliations

Global Inhibition with Specific Activation: How p53 and MYC Redistribute the Transcriptome in the DNA Double-Strand Break Response

Joshua R Porter et al. Mol Cell. .

Abstract

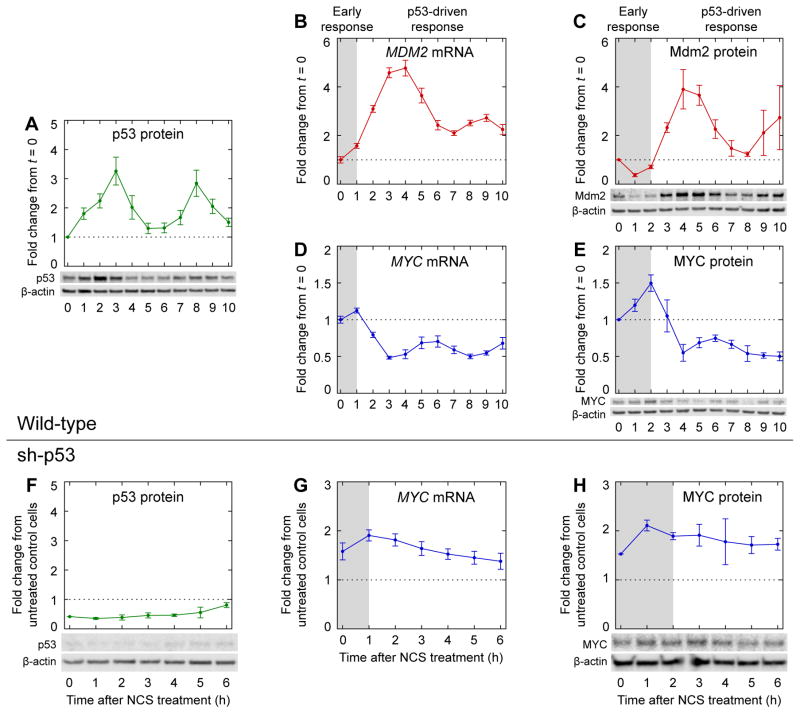
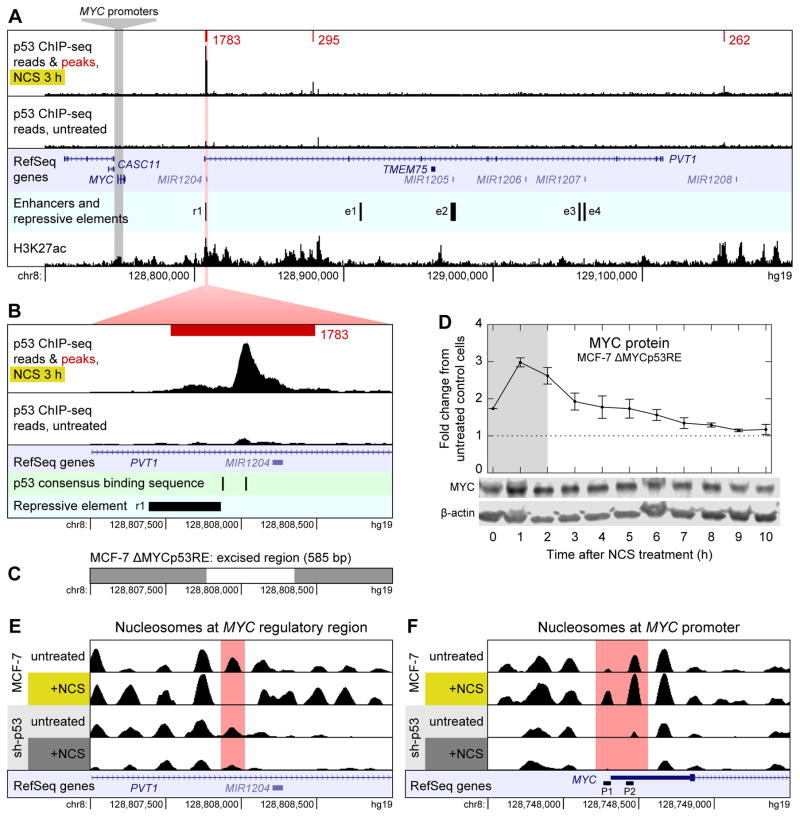
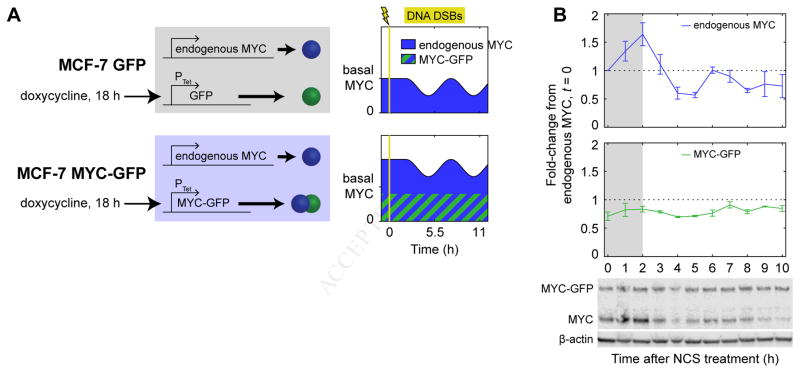
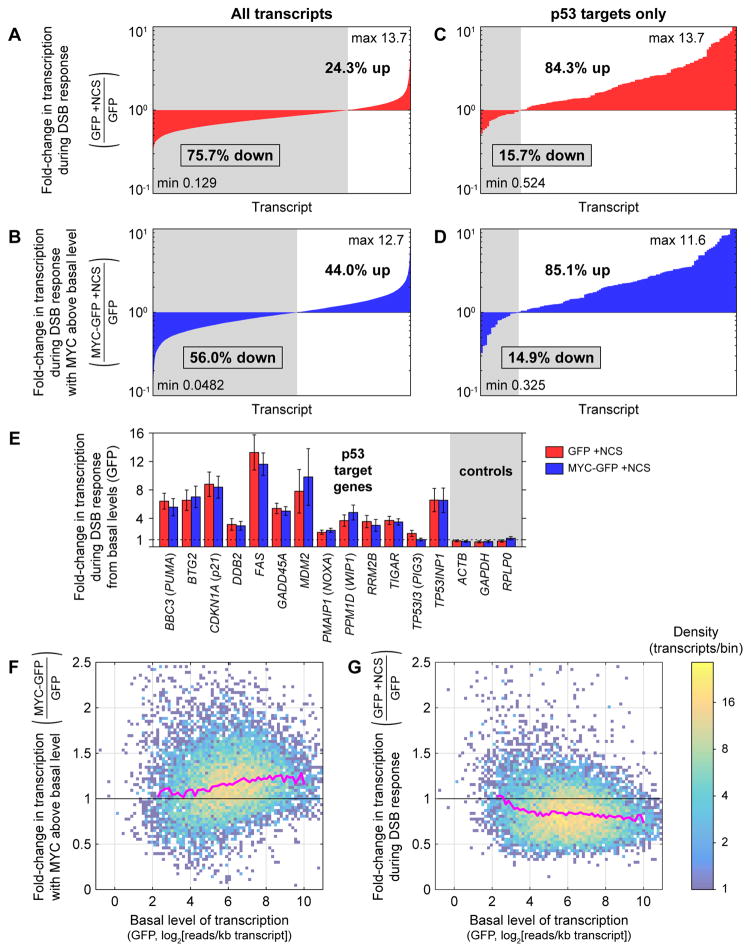
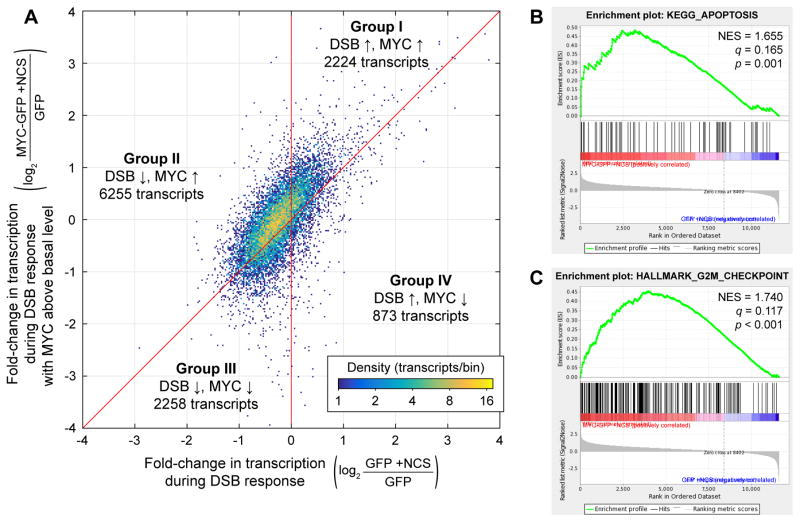
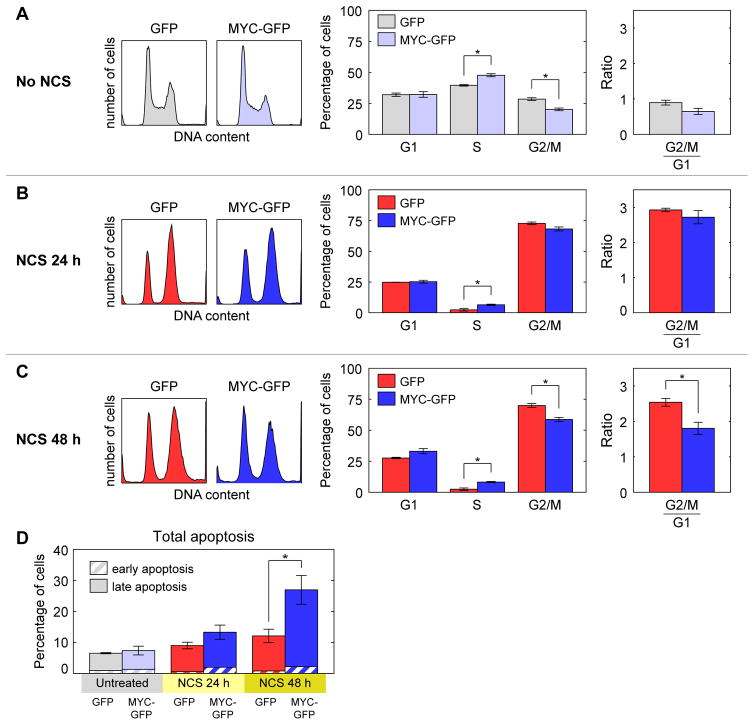
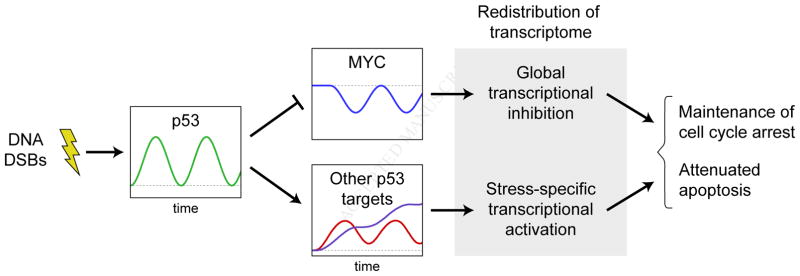
In response to stresses, cells often halt normal cellular processes, yet stress-specific pathways must bypass such inhibition to generate effective responses. We investigated how cells redistribute global transcriptional activity in response to DNA damage. We show that an oscillatory increase of p53 levels in response to double-strand breaks drives a counter-oscillatory decrease of MYC levels. Using RNA sequencing (RNA-seq) of newly synthesized transcripts, we found that p53-mediated reduction of MYC suppressed general transcription, with the most highly expressed transcripts reduced to a greater extent. In contrast, upregulation of p53 targets was relatively unaffected by MYC suppression. Reducing MYC during the DNA damage response was important for cell-fate regulation, as counteracting MYC repression reduced cell-cycle arrest and elevated apoptosis. Our study shows that global inhibition with specific activation of transcriptional pathways is important for the proper response to DNA damage; this mechanism may be a general principle used in many stress responses.

Keywords: DNA damage; MYC; apoptosis; cell cycle; p53; transcriptome.


Figures

Figure 1
Figure 1
Dynamics of key regulators during the DNA damage response. Levels of (A) p53 protein (n = 5), (C) Mdm2 protein (n = 3), and (E) MYC protein (n = 5) were measured by western blotting in MCF-7 cells treated with NCS. Levels of (B) MDM2 mRNA (n = 4) and (D) MYC mRNA (n = 4) were measured by qPCR in MCF-7 p53-Venus cells treated with NCS, as described previously (Porter et al., 2016). Levels of (F) p53 protein (n = 3) and (H) MYC protein (n = 3) were measured by western blotting in p53-knockdown cells (MCF-7 sh-p53) treated with NCS. Levels of (G) MYC mRNA (n = 4) were measured by qPCR in MCF-7 sh-p53 cells treated with NCS, as described previously (Porter et al., 2016). Measurements in (F–H) are normalized to those in untreated control cells (MCF-7 pSuper) (Brummelkamp et al., 2002). Gray backgrounds denote early response prior to p53-driven response. Data are represented as mean ± SEM.
Figure 2
Figure 2
Mechanism of p53-mediated repression of MYC. (A) ChIP-seq reads for p53 binding near MYC in MCF-7 cells treated with NCS for 3 h (top track) and untreated MCF-7 cells (second track) are shown along with p53 binding peaks (red) and their scores as called by MACS. Read counts are normalized to total reads for each treatment. Peaks shown are the intersection of those identified in n = 2 biological replicates. All peaks in a 1-Mb-wide window centered on MYC are shown. Untreated cells had no p53 binding peaks in this window. RefSeq annotated genes are shown (third track); enhancers and repressive element (fourth track) were identified by Fulco et al. (2016). H3K27ac ChIP-seq reads (bottom track) are from the ENCODE project (Dunham et al., 2012). (B) Close-up view of the largest p53 binding peak shown in (A). p53 consensus binding motifs RRRCWWGYYY (El-Deiry et al., 1992) are shown in addition to data in (A). (C) Region of chromosome 8 excised by CRISPR/Cas9 to generate MCF-7 ΔMYCp53RE cell line. (D) Levels of MYC protein were measured by western blotting in NCS-treated MCF-7 ΔMYCp53RE cells. Measurements are normalized to those in untreated MCF-7 CRISPR-control cells. Data are represented as mean ± SEM (n = 3). (E) Nucleosomes in the region of chromosome 8 shown in (B) in MCF-7 and MCF-7 sh-p53 cells, treated with NCS for 3 h or not treated. Nucleosomes were identified by DANPOS from ATAC-seq data. RefSeq annotated genes are shown (bottom track). (F) Nucleosomes around the MYC promoter. RefSeq annotated genes are shown along with alternate MYC promoters P1 and P2 (bottom track). See also Figure S1.
Figure 3
Figure 3
A cell system to control MYC expression. (A) MCF-7 variants with doxycycline-inducible constructs, including schematics of desired MYC expression in cell lines. (B) MYC dynamics in MYC-GFP cells during the DSB response. Levels of MYC protein were measured by western blotting in MYC-GFP cells treated with NCS; bands for endogenous MYC and MYC-GFP were quantified separately. Gray backgrounds denote early response prior to p53-driven response. Data are represented as mean ± SEM (n = 3).
Figure 4
Figure 4
Redistribution of the transcriptome during the DNA DSB response. (A–B) Fold-changes in mean production of all cellular transcripts 2.5–3.5 h after NCS treatment in GFP cells (A) and MYC-GFP cells (B) compared with untreated GFP cells. Transcripts with at least 5 reads in each replicate (n = 3) of each cell line/treatment condition are included. Transcripts are ordered by fold-change in mean production. (C–D) Fold-changes in mean production of p53 target transcripts, as identified by Allen et al. (2014), 2.5–3.5 h after NCS treatment in GFP cells (C) and MYC-GFP cells (D) compared with untreated GFP cells. (E) Foldchanges in mean transcription of select p53 target genes and control genes 2.5–3.5 h after NCS treatment in MYC-GFP and GFP cells, compared with untreated GFP cells, as measured by RNA-seq. Data are represented as mean ± SEM (n = 3 for each condition). (F) Density plot of fold-changes in mean production of cellular transcripts in untreated MYC-GFP cells relative to untreated GFP cells as a function of mean production in untreated GFP cells. Spearman correlation coefficient between expression in untreated GFP cells and fold-change due to MYC above its basal level is ρ = 0.155. (G) Density plot of fold-changes in mean production of cellular transcripts in NCS-treated GFP cells relative to untreated GFP cells as a function of mean production in untreated GFP cells. Spearman correlation coefficient between expression in untreated GFP cells and fold-change due to NCS is ρ = −0.151. For (F–G), transcripts of length ≥ 1500 bases with at least 5 reads in each replicate (n = 3) of each cell line/treatment condition are included. Pink lines represent median fold-change in each bin, calculated for bins with at least 40 transcripts. See also Figure S2 and Table S1.
Figure 5
Figure 5
Effects of MYC levels on the transcriptome during the DNA DSB response. (A) Density plot of fold-changes in mean transcription in NCS-treated MYC-GFP cells (n = 3) relative to untreated GFP cells (n = 3) vs. fold-changes in mean transcription in NCS-treated GFP cells (n = 3) relative to untreated GFP cells (n = 3). Transcripts are divided into Groups I–IV based on their fold-change due to the DSB response and their fold-change due to MYC held above its basal level during the DSB response. (B–C) Examples of apoptosis- and cell cycle-related gene sets found to be significantly enriched in NCS-treated MYC-GFP cells over NCS-treated GFP cells. Normalized enrichment scores (NES), false discovery rate q-values, and nominal p-values are shown. See also Figure S3 and Table S2.
Figure 6
Figure 6
MYC-mediated effects on cell fate during the DNA DSB response. (A–C) Cell cycle distributions of MYC-GFP and GFP cells that were (A) not treated with NCS, (B) treated with NCS for 24 h, or (C) treated with NCS for 48 h. Data are represented as mean ± SEM (n = 3). (D) Annexin V (AV) and propidium iodide (PI) staining showing the percentage of cells in early apoptosis (high AV, low PI) and late apoptosis (high AV, high PI) in RPE1 MYC-GFP and RPE1 GFP cells after the indicated treatments. Data are represented as mean ± SEM (n = 4). Asterisks (*) denote statistically significant differences between MYC-GFP and GFP cells or between RPE1 MYC-GFP and RPE1 GFP cells (p < 0.05, two-sample T test).
Figure 7
Figure 7
During the DSB response, p53 acts through MYC along with its other targets, suppressing transcription of most genes while selectively activating genes involved in the response. This redistribution of the transcriptome guides cell fate decisions.

References

    1. Agarwal V, Bell GW, Nam JW, Bartel DP. Predicting effective microRNA target sites in mammalian mRNAs. eLife. 2015;4:e05005. - PMC - PubMed
    1. Allen MA, Andrysik Z, Dengler VL, Mellert HS, Guarnieri A, Freeman JA, Sullivan KD, Galbraith MD, Luo X, Kraus WL, et al. Global analysis of p53-regulated transcription identifies its direct targets and unexpected regulatory mechanisms. eLife. 2014;3:e02200. - PMC - PubMed
    1. Barski A, Cuddapah S, Cui K, Roh TY, Schones DE, Wang Z, Wei G, Chepelev I, Zhao K. High-Resolution Profiling of Histone Methylations in the Human Genome. Cell. 2007;129:823–837. - PubMed
    1. Batchelor E, Mock CS, Bhan I, Loewer A, Lahav G. Recurrent initiation: a mechanism for triggering p53 pulses in response to DNA damage. Mol Cell. 2008;30:277–289. - PMC - PubMed
    1. Batchelor E, Loewer A, Mock C, Lahav G. Stimulus-dependent dynamics of p53 in single cells. Mol Syst Biol. 2011;7 - PMC - PubMed

MeSH terms