. 2017 Oct 3;25(10):1481-1494.e4.
doi: 10.1016/j.str.2017.07.014. Epub 2017 Aug 31.

Achieving a Graded Immune Response: BTK Adopts a Range of Active/Inactive Conformations Dictated by Multiple Interdomain Contacts

Affiliations

Achieving a Graded Immune Response: BTK Adopts a Range of Active/Inactive Conformations Dictated by Multiple Interdomain Contacts

Raji E Joseph et al. Structure. .

Abstract

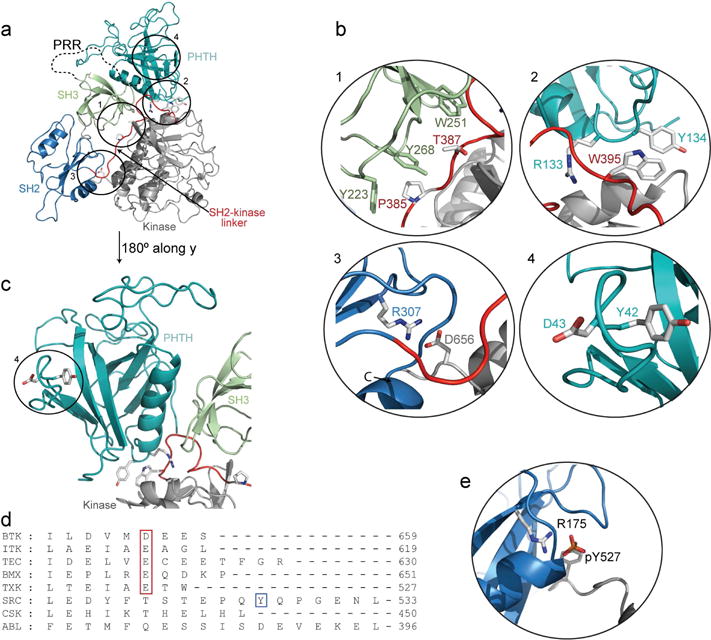
Capturing the functionally relevant forms of dynamic, multidomain proteins is extremely challenging. Bruton's tyrosine kinase (BTK), a kinase essential for B and mast cell function, has stubbornly resisted crystallization in its full-length form. Here, nuclear magnetic resonance and hydrogen-deuterium exchange mass spectrometry show that BTK adopts a closed conformation in dynamic equilibrium with open, active conformations. BTK lacks the phosphotyrosine regulatory tail of the SRC kinases, yet nevertheless achieves a phosphotyrosine-independent C-terminal latch. The unique proline-rich region is an internal "on" switch pushing the autoinhibited kinase toward its active state. Newly identified autoinhibitory contacts in the BTK pleckstrin homology domain are sensitive to phospholipid binding, which induces large-scale allosteric changes. The multiplicity of these regulatory contacts suggests a clear mechanism for gradual or "analog" kinase activation as opposed to a binary "on/off" switch. The findings illustrate how previously modeled information for recalcitrant full-length proteins can be expanded and validated with a convergent multidisciplinary experimental approach.

Keywords: BTK; TEC; autoinhibition; conformational equilibria; crystallization-resistant proteins; kinase regulation.


Figures

Fig. 1
Fig. 1. BTK is a multi-domain protein
(a) BTK domains and fragments used in this study. The proline rich region (PRR) is shown as a dotted line. (b) Model of autoinhibited FL BTK (Wang et al., 2015).
Fig. 2
Fig. 2. NMR and HDX are consistent with compact autoinhibited BTK SH3-SH2-kinase
(a) Chemical shift changes between the isolated SH3, SH2 and SH3-SH2. Red indicates chemical shift change and blue no change in resonance frequency. Gray shows ambiguity in assignment. Cartoon above the structure indicates the BTK construct studied; the red dashed box indicates the domain/s being monitored, here and in subsequent figures. W251 in SH3 and R307 in the pY pocket of SH2 are labeled. (b) Chemical shift changes in the isolated SH3 and SH2 domains in the context of FL BTK. Colors same as (a). PHTH and kinase domains are surface rendered. (c) Superpositions of 1H-15N TROSY-HSQC spectra of SH3 (green) and SH2 (blue) with (i) SH3–SH2 (black) and (ii) FL BTK (black). W251 and R307 resonances are boxed. (d) HDX changes in SH3-SH2 in the context of FL BTK (DFL − DSH3-SH2, D = Relative deuterium incorporation, here and all subsequent figures). Regions of protection are shown in purple, and exposure in green, here and all subsequent figures. (e) HDX difference data in (d) mapped onto autoinhibited FL BTK. Here and in all subsequent figures differences between 0.5 Da to 1.0 Da are shown as light blue (modest decrease) or light pink (modest increase), while differences greater than 1.0 Da are shown as dark blue (meaningful decrease) or red (meaningful increase). No change is gray and absence of data is pale peach. SH3-SH2 is shown in ribbons and PHTH and kinase domains are surface rendered. (e) HDX changes in (i) D3-2-L-KD − DL-KD and (ii) D2-L-KD − DL-KD. (i) Mapping changes from (h(i)) onto the structure of the BTK 3-2-L-KD. The L-KD is shown in ribbons and the SH3 and SH2 domains are shown as surfaces for context. See also Fig. S1 and Data S1.
Fig. 3
Fig. 3. Interdomain contacts in FL BTK
(a) Model of autoinhibited FL BTK with PHTH (teal), PRR (dotted line) SH3 (green), SH2 (blue), SH2-kinase linker (red) and kinase domain (grey). (b) Interdomain contacts (circled and numbered in the FL model): (1) SH2-kinase linker (red) is sandwiched between the SH3 (green) and kinase domain (grey). Y223, Y268 and W251 in SH3 and P385 and T387 in SH2-kinase linker are shown. (2) In the model of FL BTK, R133 and Y134 in the PHTH domain are adjacent to W395 and the C-helix (grey) of the BTK kinase domain. (3) R307 forms a salt bridge with D656 from the kinase domain C-terminus. (4) Y42 and D43 in the BTK PHTH domain (teal) are not close in space to the kinase domain in the model of FL BTK (Wang et al., 2015). (c) Alternate view of the BTK PHTH domain in the autoinhibited structure. (d) Sequence alignment of the C-terminus of the TEC family, SRC, CSK and ABL kinase domains. Acidic nature of BTK D656 is conserved in TEC kinases (boxed, red). The C-terminal conserved tyrosine in SRC kinase is boxed (blue). (e) Structure of the autoinhibited SRC kinase (PDB: 1FMK) showing the C-terminal pY527 interaction with the conserved R175 in the SH2 binding pocket. C-terminal tail is gray and SH2 domain is blue.
Fig. 4
Fig. 4. Characterization of FL BTK mutants
(a) Location of W251 and W395 (sticks, orange) in autoinhibited BTK. BTK PHTH (teal), SH3 (green), SH2-kinase linker (red) and kinase domain (grey). (b) 1H-15N TROSY-HSQC spectra showing W395 resonance in wild type (WT) FL BTK (i), with added peptide ligands for SH3 (ii) and SH2 (iii). The two dashed lines indicate the positions of W395 resonance in WT FL BTK; the upfield W395 peak corresponds to the autoinhibited, inactive conformation and the downfield peak corresponding to the open, active conformation of BTK, here and in all subsequent figures. (c) 1H-15N TROSY-HSQC spectra showing W395 resonance for FL BTK mutants: (i) P385A/T387A, (ii) D656K and (iii) PRR(A) (proline rich region mutant: P189A/P192A/P203A/P204A). (d & e) Western blot showing the kinase activity of 6XHis-FL BTK WT and mutants: BTK P385A/T387A, BTK D656K and BTK PRR(A). Here and in subsequent figures autophosphorylation on BTK is monitored using an Anti-pY antibody and total protein levels are monitored with an Anti-6XHis antibody. (e) Histogram showing the BTK activity data in (d). Phosphorylation levels in the Anti-pY blot were quantified and divided by the total protein level (Anti-His blot). Activity of the FL WT BTK = 1, and the relative activity of BTK mutants is shown. Data is the average of three independent experiments. (f) 1H-15N TROSY-HSQC spectra showing that the PRR occupies BTK SH3 in the PHTH-PRR-SH3 fragment. Superposition of the region 1H-15N TROSY-HSQC spectra containing the W251 resonance for: (i) BTK PHTH-PRR-SH3 (red) and BTK SH3 (black), and (ii) BTK PHTH-PRR-SH3 (red) and the PRR mutant BTK PHTH-PRR(A)-SH3 (cyan). See also Fig. S2, S3 and S4.
Fig. 5
Fig. 5. HDX of mutants and WT FL BTK
HDX data for FL BTK mutants: (a) DP385A/T387A FL − DWT FL, (b) DD656K FL − DWT FL and (c) DPRR(A) FL − DWT FL. (d) Mapping HDX results from (a) onto the autoinhibited BTK model. Asterisks indicate the position of mutations within FL BTK. Details of the changes that occur in (1) BTK FL P385A/T387A at the BTK SH2 domain/C-terminal kinase tail, (2) in the BTK FL D656K mutant within the BTK kinase domain N-lobe and (3) the BTK PHTH domain. See also Data S1.
Fig. 6
Fig. 6. Activation of BTK by PIP3 liposomes
(a) BTK activity monitored either in the absence of liposomes, or the presence of PIP3 or control liposomes. (b) Quantification of data in (a) was done as in Fig. 3e. Data is the average of three experiments. (c) HDX data for FL BTK in the presence and absence of PIP3 left panel: DControl lipids + FL − DLipid free FL, right panel: DPIP3 lipids + FL − DControl lipids + FL. (d) PIP3 induced HDX changes on the SAXS derived structure of FL BTK (SASBDB ID: SASDC52). PRR, linker between SH3 and SH2 and the SH2-kinase linker are shown as dotted lines. PIP3 is shown as sticks. The modest increase in deuterium exposure observed in the SH2-kinase linker is indicated as a light pink box. (e) Close-up of HDX results mapped onto the BTK kinase domain. Regions of increased exchange: β2 strand, β2– β3 loop and the activation segment adjacent to the autophosphorylation site Y551 are labeled. See also Data S1.
Fig. 7
Fig. 7. Mutation of the BTK PHTH domain activates FL BTK
(a) Trp side chain region of the 1H−15N TROSY-HSQC spectrum of WT FL BTK (i) and BTK mutants. While no major change is observed for FL BTK R133E/Y134E (ii), BTK Y42A/D43A (iii) shifts the conformational equilibrium to the active state. (b) Differences in HDX between WT and mutant BTK: (i) DR133E/Y134E FL − D WT FL, (ii) DY42A/D43A FL − DWT FL. (c) Western blot showing the kinase activity of 6XHis-tagged FL WT BTK, BTK Y42A/D43A and BTK R133E/Y134E. (d) Histogram showing the BTK activity data in (c). The phosphorylation levels were quantified and normalized as in Fig. 3e and averaged of three independent experiments. (e) HDX differences comparing FL BTK to BTK Y42A/D43A (b(ii)) mapped onto the autoinhibited BTK model along with close up views of increased deuterium incorporation. See also Data S1.
Fig. 8
Fig. 8. BTK PHTH domain mapping
(a) DFL − DPHTH. (b) Deuterium incorporation curves for (i) β3 loop peptide, (ii) peptide containing R133/Y134 in the isolated BTK PHTH domain (red trace), and in the context of FL BTK (blue trace). (c) Differences in HDX from (a) on the structure of the BTK PHTH domain. Y42 and D43 are shown. (d) DFL − D3-2-L-KD. (e) HDX differences in (d) mapped onto the model of FL BTK. 3-2-L-KD is shown in ribbons and the PHTH domain is surface rendered. Close up views of changes in the C-lobe and in the SH2-kinase linker are shown. See also Data S1.

Comment in

References

    1. Altan-Bonnet G, Germain RN. Modeling T cell antigen discrimination based on feedback control of digital ERK responses. PLoS Biol. 2005;3:e356. - PMC - PubMed
    1. Andreotti AH, Bunnell SC, Feng S, Berg LJ, Schreiber SL. Regulatory intramolecular association in a tyrosine kinase of the Tec family. Nature. 1997;385:93–97. - PubMed
    1. Andreotti AH, Schwartzberg PL, Joseph RE, Berg LJ. T-cell signaling regulated by the Tec family kinase. Itk Cold Spring Harb Perspect Biol. 2010;2:a002287. - PMC - PubMed
    1. Au-Yeung BB, Zikherman J, Mueller JL, Ashouri JF, Matloubian M, Cheng DA, Chen Y, Shokat KM, Weiss A. A sharp T-cell antigen receptor signaling threshold for T-cell proliferation. Proc Natl Acad Sci U S A. 2014;111:E3679–3688. - PMC - PubMed
    1. Boyken SE, Chopra N, Xie Q, Joseph RE, Wales TE, Fulton DB, Engen JR, Jernigan RL, Andreotti AH. A conserved isoleucine maintains the inactive state of Bruton’s tyrosine kinase. J Mol Biol. 2014;426:3656–3669. - PMC - PubMed

LinkOut - more resources