. 2017 Jun 6:6:787.
doi: 10.12688/f1000research.11773.2. eCollection 2017.

Improved deconvolution of very weak confocal signals

Affiliations

Improved deconvolution of very weak confocal signals

Kasey J Day et al. F1000Res. .

Abstract

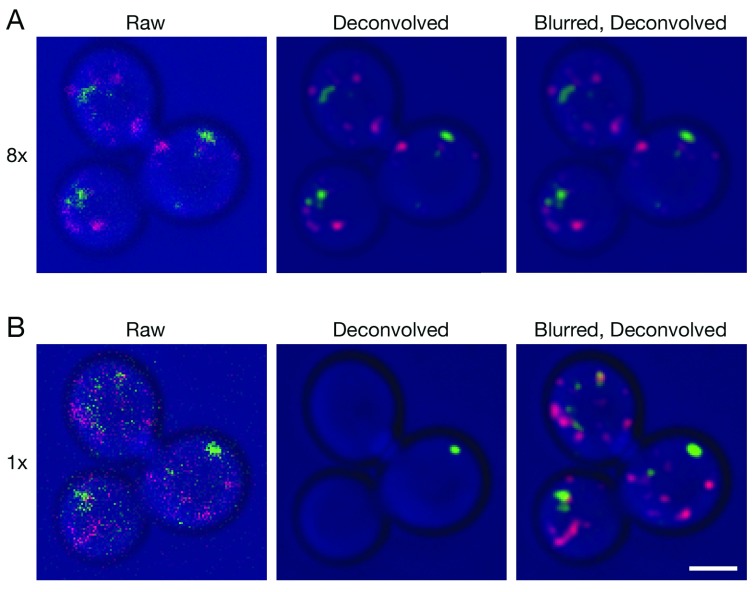
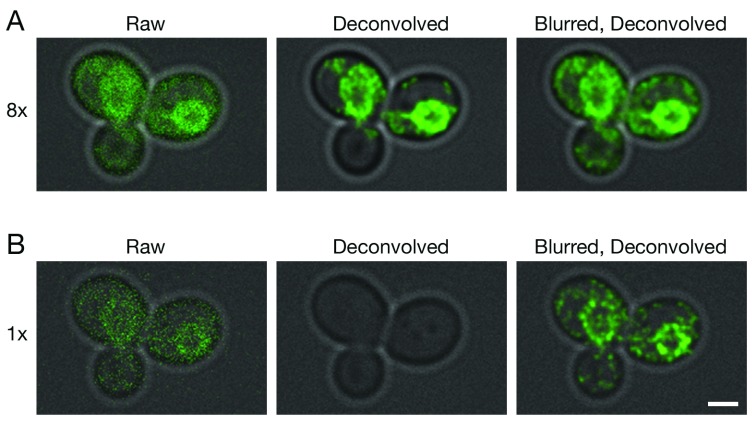
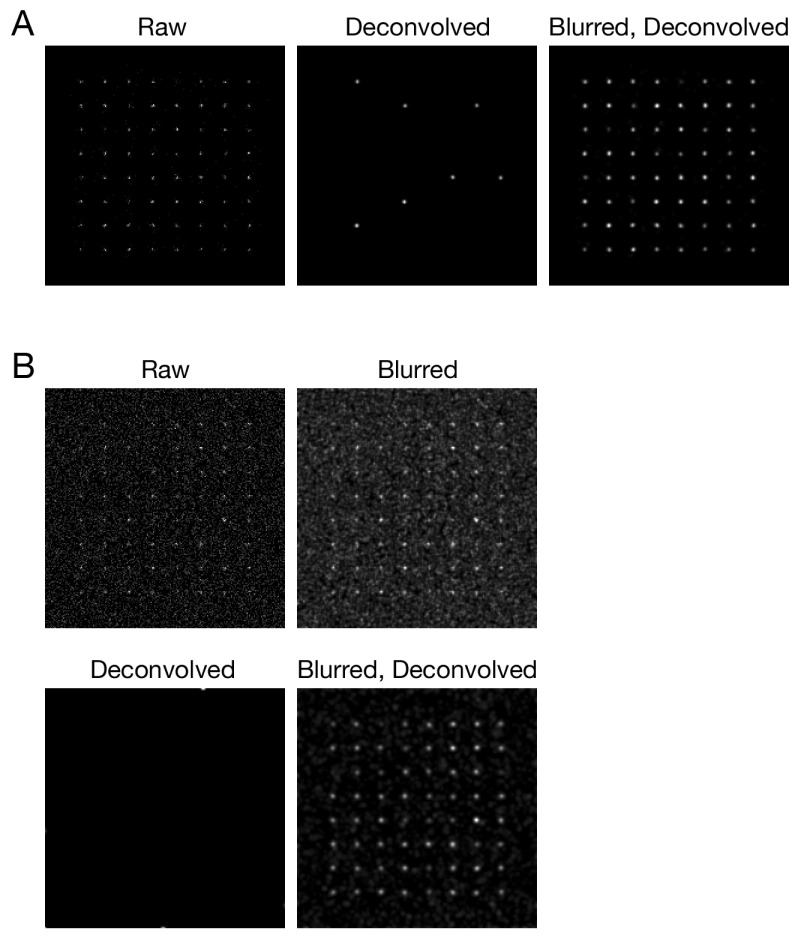
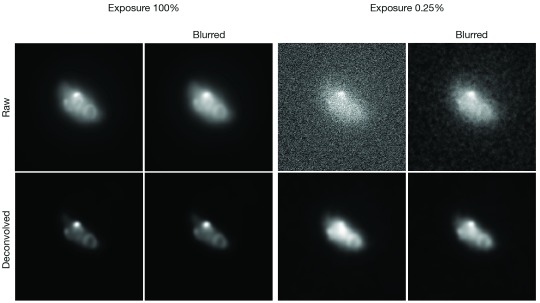
Deconvolution is typically used to sharpen fluorescence images, but when the signal-to-noise ratio is low, the primary benefit is reduced noise and a smoother appearance of the fluorescent structures. 3D time-lapse (4D) confocal image sets can be improved by deconvolution. However, when the confocal signals are very weak, the popular Huygens deconvolution software erases fluorescent structures that are clearly visible in the raw data. We find that this problem can be avoided by prefiltering the optical sections with a Gaussian blur. Analysis of real and simulated data indicates that the Gaussian blur prefilter preserves meaningful signals while enabling removal of background noise. This approach is very simple, and it allows Huygens to be used with 4D imaging conditions that minimize photodamage.

Keywords: 4D microscopy; Gaussian blur; Huygens; confocal microscopy; deconvolution; fluorescence microscopy; signal-to-noise.


Conflict of interest statement

Competing interests: No competing interests were disclosed.

Figures

Figure 1.
Figure 1.. Improved deconvolution of 4D live cell data with a Gaussian blur prefilter.
Gene replacement in Saccharomyces cerevisiae was used to label late Golgi cisternae with Sec7-mCherry (red) and prevacuolar endosomes with Vps8-GFP (green) ( Papanikou et al., 2015). Cells were imaged by 4D confocal microscopy. In consecutive movies, line accumulation was set to ( A) 8x or ( B) 1x. The data were average projected either with no processing, or after deconvolution with Huygens, or after prefiltering with a 2D Gaussian blur using a radius of 0.75 pixels followed by deconvolution. Fluorescence data are superimposed on differential interference contrast images of the cells (blue). Shown are representative frames from Video 1 (8x) and Video 2 (1x). The fluorescence patterns in ( A) and ( B) are similar, but not identical because the labeled structures changed during the interval between the two movies. Scale bar, 2 µm.
Figure 2.
Figure 2.. Improved deconvolution of non-punctate fluorescence signals with a Gaussian blur prefilter.
Gene replacement in Saccharomyces cerevisiae was used to label ER membranes with Hmg1-GFP ( Koning et al., 1996). A confocal Z-stack was captured with line accumulation set to ( A) 8x or ( B) 1x. The data were average projected either with no processing, or after deconvolution with Huygens, or after prefiltering with a 2D Gaussian blur using a radius of 0.75 pixels followed by deconvolution. Fluorescence data are superimposed on differential interference contrast images of the cells (gray). Scale bar, 2 µm.
Figure 3.
Figure 3.. Improved deconvolution of simulated data with a Gaussian blur prefilter.
Simulated confocal Z-stacks of fluorescent point sources were created as described in Methods, either ( A) without background noise or ( B) with background noise. The data were processed and average projected as in Figure 1.
Figure 4.
Figure 4.. Effect of a Gaussian blur prefilter on deconvolution of widefield fluorescence data.
These images of fluorescent yeast Zip1 filaments correspond to Figure 4 of Arigovindan et al. (2013). The two exposure levels represent strong (100%) or weak (0.25%) signals, respectively. Where indicated, the data were subjected either to a Gaussian blur with a radius of 1.00 pixel, or to deconvolution with Huygens, or to a Gaussian blur prefilter followed by deconvolution. The theoretical point spread function was based on imaging parameters supplied with ER-Decon.

References

    1. Agard DA, Hiraoka Y, Shaw P, et al. : Fluorescence microscopy in three dimensions. In Fluorescence Microscopy of Living Cells in Culture, Part B. Methods Cell Biol.Taylor DL and Wang Y, editors. Academic Press, San Diego.1989;30:353–377. 10.1016/S0091-679X(08)60986-3 - DOI - PubMed
    1. Arigovindan M, Fung JC, Elnatan D, et al. : High-resolution restoration of 3D structures from widefield images with extreme low signal-to-noise-ratio. Proc Natl Acad Sci U S A. 2013;110(43):17344–17349. 10.1073/pnas.1315675110 - DOI - PMC - PubMed
    1. Bevis BJ, Hammond AT, Reinke CA, et al. : De novo formation of transitional ER sites and Golgi structures in Pichia pastoris. Nat Cell Biol. 2002;4(10):750–756. 10.1038/ncb852 - DOI - PubMed
    1. Biggs DS: 3D deconvolution microscopy. Curr Protoc Cytom. 2010;Chapter 12:Unit12.19.1–20. 10.1002/0471142956.cy1219s52 - DOI - PubMed
    1. Burger W, Burge MJ: Digital Image Processing: An Algorithmic Introduction using Java. Springer, New York NY.2008. 10.1007/978-1-84628-968-2 - DOI

LinkOut - more resources