. 2017 Oct;20(10):1404-1412.
doi: 10.1038/nn.4635. Epub 2017 Sep 4.

Seeing faces is necessary for face-domain formation

Affiliations

Seeing faces is necessary for face-domain formation

Michael J Arcaro et al. Nat Neurosci. 2017 Oct.

Abstract

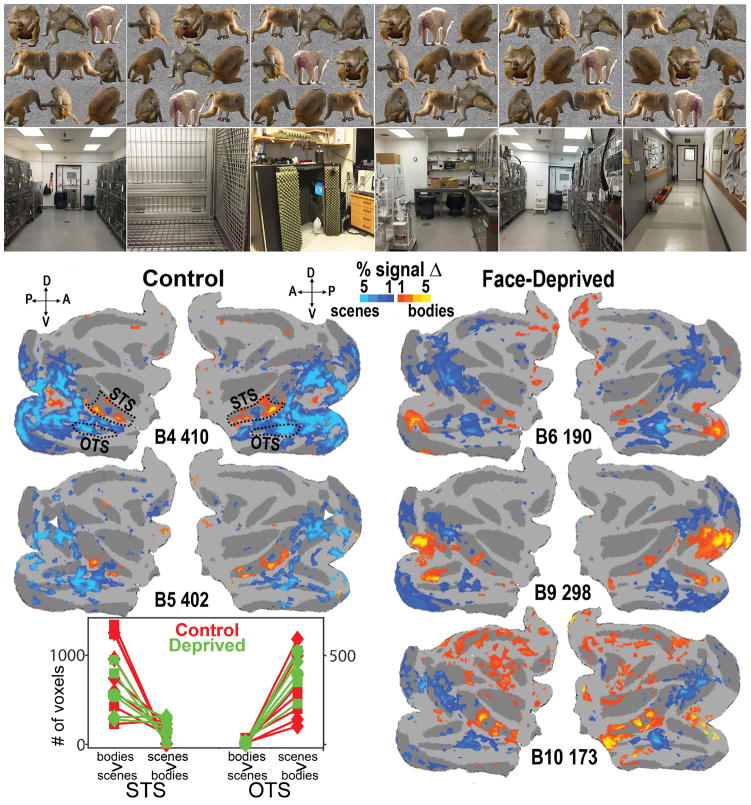
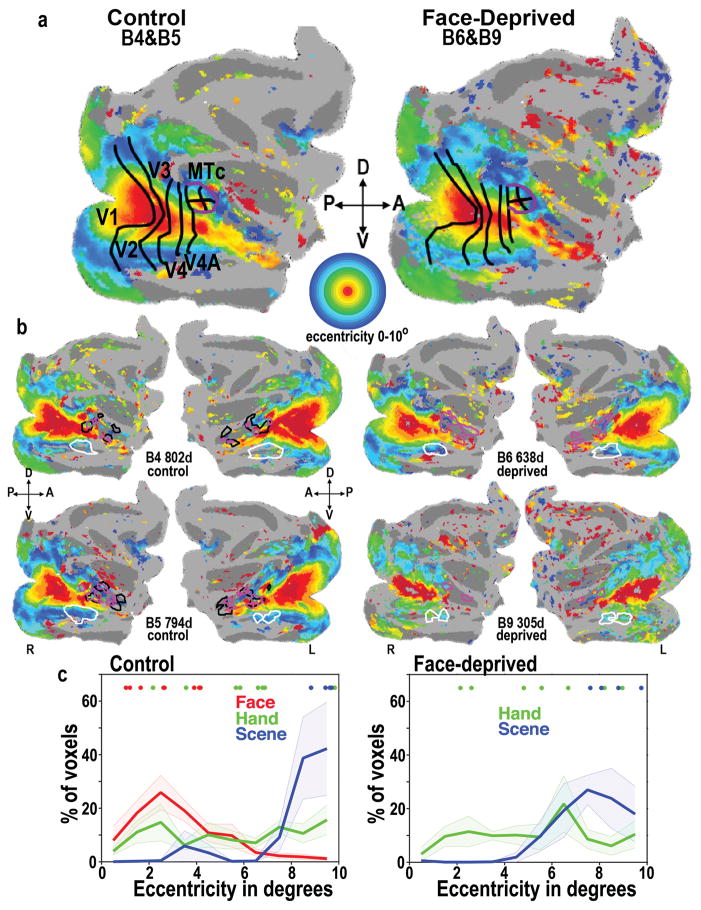
Here we report that monkeys raised without exposure to faces did not develop face domains, but did develop domains for other categories and did show normal retinotopic organization, indicating that early face deprivation leads to a highly selective cortical processing deficit. Therefore, experience must be necessary for the formation (or maintenance) of face domains. Gaze tracking revealed that control monkeys looked preferentially at faces, even at ages prior to the emergence of face domains, but face-deprived monkeys did not, indicating that face looking is not innate. A retinotopic organization is present throughout the visual system at birth, so selective early viewing behavior could bias category-specific visual responses toward particular retinotopic representations, thereby leading to domain formation in stereotyped locations in inferotemporal cortex, without requiring category-specific templates or biases. Thus, we propose that environmental importance influences viewing behavior, viewing behavior drives neuronal activity, and neuronal activity sculpts domain formation.


Conflict of interest statement

COMPETINGNG FINANCNCIAL INTERESTS

The authors declare no competing financial interests.

Figures

Figure 1
Figure 1
Faces>objects and hands>objects activations in control and face-deprived monkeys. (top) Example maps for the contrast faces-minus-objects aligned onto a standard F99 macaque flattened cortical surface (light gray=gyri; dark gray=sulci). These examples show % signal change (beta coefficients) thresholded at p<0.01 (FDR corrected) for one session each for two control (B4&B5; left) and two face-deprived (B6&B9; right) monkeys at 252, 262, 295, & 270 days old, as indicated. Dotted white ovals indicate the STS region shown in the bottom half for all the scan sessions for all 7 monkeys. Dotted black outline in the B4 map shows the STS ROI used for the correlation analysis described in the text. (bottom) Faces>objects and hands>objects beta coefficients thresholded at p<0.01 (FDR corrected) for all the individual scan sessions at the ages (in days) indicated for 4 control monkeys (B3,B4,B5&B8; left) and 3 face-deprived monkeys (B6,B9&B10; right). For all but the 5 scan sessions indicated by colored lettering, the images were single large monkey faces, monkey hands, or objects (Supplementary Fig. 1). For the scan sessions B4 508, B5 500, and B6 302 the hands were gloved human hands; for scan sessions B3 824 and B10 173 the stimuli were mosaics of monkey faces, monkey hands, or objects rather than single large images (these were sessions in which scenes were also presented, and mosaics were used to equate visual-field coverage; as in Fig. 3 top). The small red numbers indicate the number of blocks of each category type included in the analysis for each session.
Figure 2
Figure 2
Quantification of face and hand activations in control and face-deprived monkeys. (a) Conjunction analysis: Flat maps show the proportion of sessions for each monkey (that was scanned in multiple sessions) for which each voxel was significantly more activated by faces>objects or by hands>objects for 3 control monkeys (left) and three face-deprived monkeys (right). Significance threshold for each session was p<0.01 (FDR corrected). The 5 previously described face patches typically found in control monkeys are labeled in the B8 face map,. Across sessions, face patch AM was consistently significant in only monkey B8, though present subthreshold in B4 and B5. In B4 areal borders between V1, V2, V3, V4, and V4A are indicated in black, and the MT cluster is outlined in purple; areas were determined by retinotopic mapping at 2 years of age in the same monkey. Graphs b,c,e,f provide a quantitative comparison of face and hand activations in 4 control and 3 face-deprived monkeys. (b) Number of voxels in an anatomically-defined entire-STS ROI (outlined in B4 face map) that were significantly more activated by faces than by objects (horizontal axis) compared to the number of voxels in the same ROI that were significantly more activated by hands than by objects (vertical axis); voxels selected at p<0.01 FDR corrected threshold. Different symbols represent different monkeys (see legend in panel c), and each symbol represents data from one hemisphere from one scan session for one control (red) or one face-deprived (green) monkey. Large black-outlined symbols show means for each monkey across sessions and hemispheres (for B3 only across hemispheres). (c) Percent signal change in a central V1 ROI (central 6–7° of visual field) in response to faces (horizontal axis) and to hands (vertical axis). Each symbol represents data from one hemisphere for one scan session for one monkey; large symbols show means for each monkey that was scanned multiple times; single-session mean across hemispheres for B3 is highlighted in black. (d) Overlays of face (black) and hand (white) patches for each of the control monkeys from the conjunction analysis. (e) Average percent signal change (shading indicates sem) to faces-minus-objects (solid lines) and hands-minus-objects (dotted lines) as a function of ventrolateral to dorsomedial distance along an anatomically defined CIT ROI extending from the crown of the lower lip of the STS to the upper bank of the STS (left dotted outline on the B5 face map; arrow on map corresponds to x axis on graph). Data were averaged over all sessions and both hemispheres of all three control monkeys that were scanned multiple times (red lines) and all three face-deprived monkeys (green lines). Activations were averaged across the AP dimension of the ROI to yield an average response as a function of mediolateral location. (f) Same as (e) but for an anatomically defined AIT ROI (right dotted outline on the B5 face map).
Figure 3
Figure 3
Activations to bodies vs scenes. (top) Subset of the images used for bodies vs scenes scans. (bottom) Maps of responses (beta values) for bodies vs scenes, thresholded at p<0.01, FDR corrected, for 2 control monkeys and 3 face-deprived monkeys at the ages indicated in days. The two control monkeys were scanned in an additional session, with similar activation patterns (B4 326 and B5 318). Scene activations that corresponded to previously described scene patches were present in all monkeys: the ventral scene region in each monkey corresponds to the Lateral Place Patch (LPP) in the occipitotemporal sulcus (outlined in the B4 map), and the more dorsal region (white arrowheads in B5 map) corresponds to the Dorsal Scene Patch, in dorsal prelunate cortex, the potential homologue of human TOS. Note also the stereotyped bodies>scenes activations lying along the STS in all monkeys. The graph shows the number of voxels in each monkey in each session in each hemisphere in each ROI (outlined in the B4 maps) that was significantly more responsive to bodies than to scenes or the reverse, as indicated (voxels selected at a p<0.01 FDR corrected threshold); each symbol corresponds to one monkey, as in Fig. 2c; red symbols controls, green deprived.
Figure 4
Figure 4
Eccentricity organization in control and face-deprived monkeys. Eccentricity, from 0° (red) to 10° (blue) as indicated by the circular color scale, was mapped using expanding and contracting annuli of flickering checkerboard patterns. (a) Average eccentricity organization for two control monkeys (B4&B5) on the left, and two face-deprived monkeys (B6&B9) on the right. Thick black lines indicate areal borders of (L to R) V1, V2, V3, V4 V4A, and the purple outline indicates the MT cluster, comprising areas MT, MST, FST< and V4t. Across 19 retinotopic areas the mean voxelwise distance between the average control-monkey eccentricity map and the average face-deprived eccentricity map was 0.9°+1°s.d. The correlation (r) between control and face-deprived averaged maps was 0.82. Even considering only the inferotemporal cortical areas the mean difference between control and deprived averaged maps was 1.4°+1.5°s.d.; correlation = 0.66, which is comparable to the consistency between individual control monkeys (1.84°+1.76°s.d.; correlation = 0.54). (b) Individual maps for each hemisphere for each monkey, thresholded at p<0.01. Outlines of the conjunction ROIs for faces (black), hands (magenta), and the ventral scene area (white) for each hemisphere in each monkey are overlaid on each monkey’s own eccentricity map. The B9 eccentricity map is less clear than those of the older monkeys because younger monkeys do not fixate as well or as long as older monkeys. (c) Histograms of eccentricity representations (1° bins) within each category-selective ROIs averaged across hemispheres for control and deprived monkeys. Shading indicates sem. Dots above graphs indicate the mapped eccentricity of the most category-selective voxel in each face-, hand-, or scene- ROI for each hemisphere for each monkey for CIT patches and AIT patches; color indicates ROI category.
Figure 5
Figure 5
Looking behavior of control and face-deprived monkeys. (a) Normalized heat maps of fixations for 9 of the images the monkeys freely viewed while gaze was monitored. In the leftmost panel for each of the face&hand images, red boxes outline the face regions and green boxes the hand regions used for analysis in panels b–d. Heat maps combine data from 4 control and 3 face-deprived monkeys overlaid onto a darkened version of the image viewed. (Left bottom photograph by Alan Stubbs, courtesy of the Neural Correlate Society. Middle middle photograph courtesy of David M. Barron/oxygengroup. Lower middle photograph by Pawel Opaska, used with permission. Top middle image is a substitute image for a configurally identical image that we do not have permission to reproduce.) (b) Quantification of looking behavior for 4 control (red) and 3 face-deprived (green) monkeys from 90 days to 1 year of age. Large black-outlined symbols show mean for each monkey. (c) Longitudinal looking behavior for 4 control monkeys from 2 days to >1 year of age at regions containing faces (filled symbols) or at regions containing hands (open symbols). Each symbol represents the % average looking time at hand or face regions, minus the % of the entire image covered by the hand or face region, over one viewing session. Yellow bar indicates the range of ages at which control monkeys developed strong stable face patches. (d) Same as c for 3 face-deprived monkeys from 90 to 383 days of age.

References

    1. McKone E, Crookes K, Jeffery L, Dilks DD. A critical review of the development of face recognition: experience is less important than previously believed. Cogn Neuropsychol. 2012;29:174–212. - PubMed
    1. McKone E, Crookes K, Kanwisher N. The cognitive and neural development of face recognition in humans. In: Gazzaniga M, editor. The Cognitive Neurosciences. 4. MIT Press; Cambridge, MA: 2009. pp. 467–482.
    1. Goren CC, Sarty M, Wu PY. Visual following and pattern discrimination of face-like stimuli by newborn infants. Pediatrics. 1975;56:544–549. - PubMed
    1. Johnson MH, Dziurawiec S, Ellis H, Morton J. Newborns’ preferential tracking of face-like stimuli and its subsequent decline. Cognition. 1991;40:1–19. - PubMed
    1. Mendelson MJ, Haith MM, Goldman-Rakic PS. Face scanning and responsiveness to social cues in infant rhesus monkeys. Developmental Psychology. 1982;18:222–228.

LinkOut - more resources