Comparative Study
. 2017 Oct;49(10):1468-1475.
doi: 10.1038/ng.3949. Epub 2017 Sep 4.

Identification of 153 new loci associated with heel bone mineral density and functional involvement of GPC6 in osteoporosis

Affiliations
Comparative Study

Identification of 153 new loci associated with heel bone mineral density and functional involvement of GPC6 in osteoporosis

John P Kemp et al. Nat Genet. 2017 Oct.

Abstract

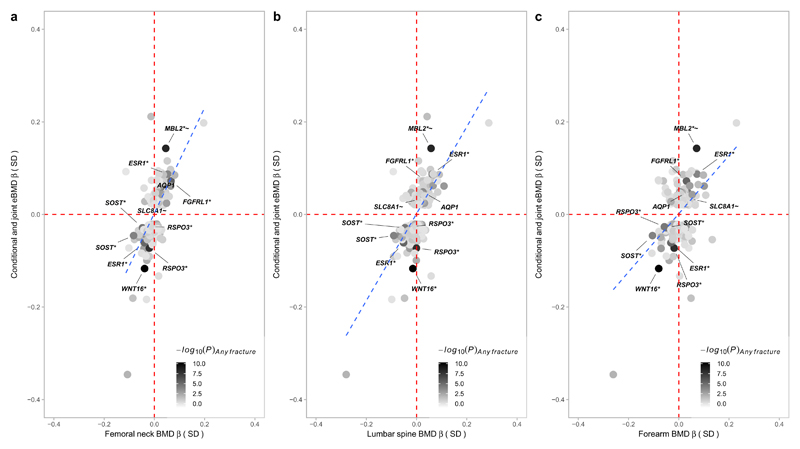
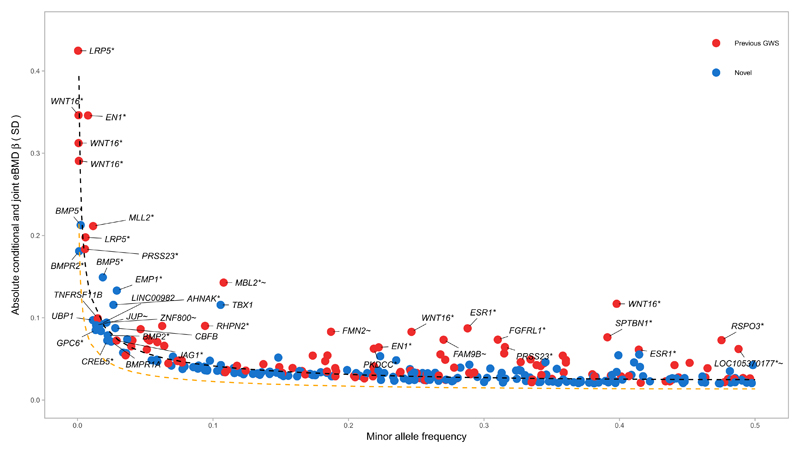
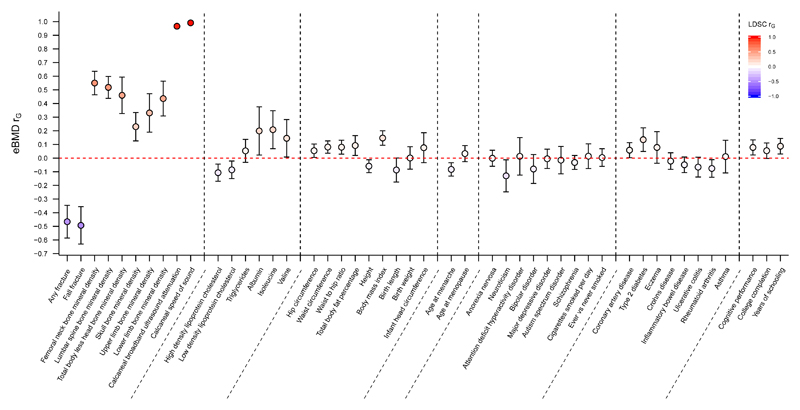
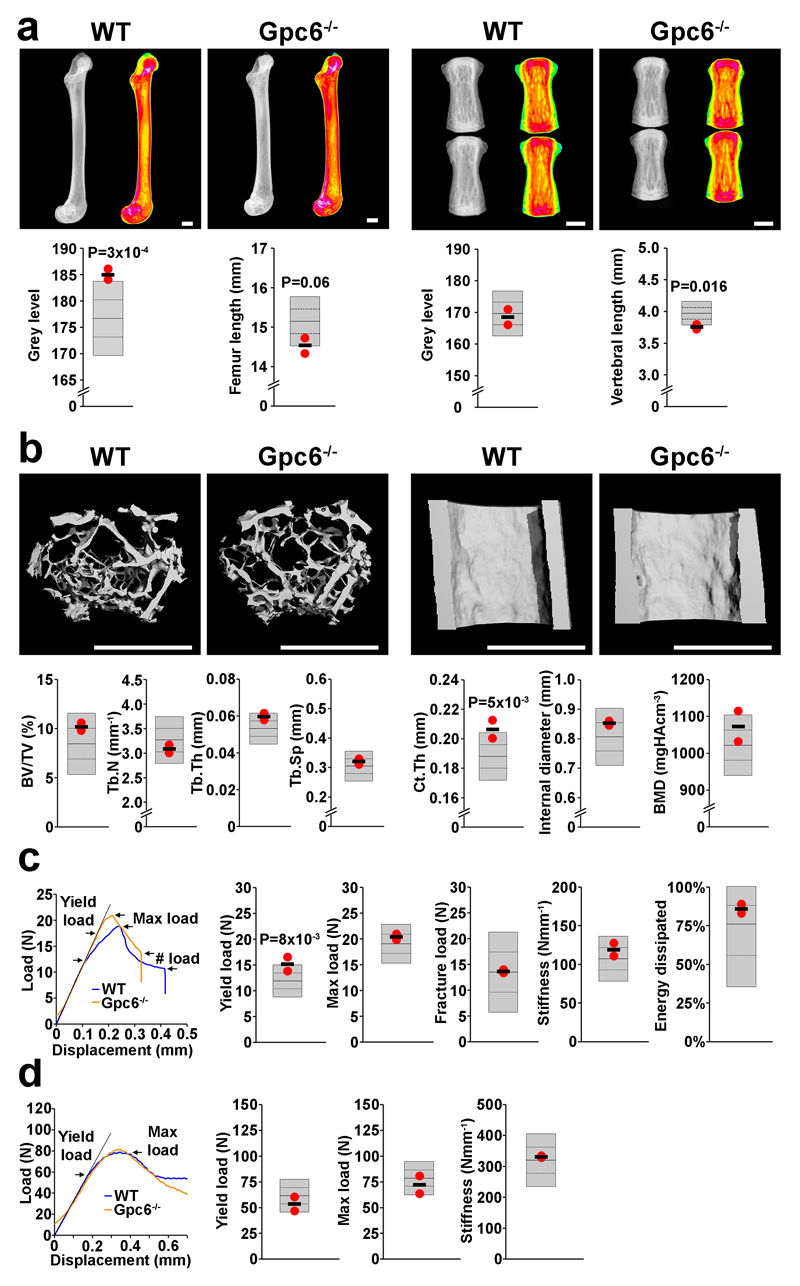
Osteoporosis is a common disease diagnosed primarily by measurement of bone mineral density (BMD). We undertook a genome-wide association study (GWAS) in 142,487 individuals from the UK Biobank to identify loci associated with BMD as estimated by quantitative ultrasound of the heel. We identified 307 conditionally independent single-nucleotide polymorphisms (SNPs) that attained genome-wide significance at 203 loci, explaining approximately 12% of the phenotypic variance. These included 153 previously unreported loci, and several rare variants with large effect sizes. To investigate the underlying mechanisms, we undertook (1) bioinformatic, functional genomic annotation and human osteoblast expression studies; (2) gene-function prediction; (3) skeletal phenotyping of 120 knockout mice with deletions of genes adjacent to lead independent SNPs; and (4) analysis of gene expression in mouse osteoblasts, osteocytes and osteoclasts. The results implicate GPC6 as a novel determinant of BMD, and also identify abnormal skeletal phenotypes in knockout mice associated with a further 100 prioritized genes.


Conflict of interest statement

Competing Financial Interests Statement

Authors declare no competing financial interests.

Figures

Figure 1
Figure 1. Effect size in standard deviations for heel eBMD (y-axis) from the current UK Biobank Study plotted against effect size in standard deviations from the previous GEFOS-Seq paper for BMD at the (A) femoral neck, (B) lumbar spine, and (C) forearm (x-axis).
Only conditionally independent variants that reach genome-wide significance (P < 6.6 x10⁻⁹) for eBMD in the UK Biobank Study are plotted. Minus log10P-value for the (any) fracture analysis in UK Biobank is represented by the shading of the data points (black for robust evidence of association with fracture and white for poor evidence of association). SNPs that reach Bonferroni corrected significance for fracture (P < 1.6 x10⁻⁴) are labelled in the diagram. The blue dashed trend line shows a strong correlation between estimated effect sizes at the heel and at other sites of the body. SNPs at SLC8A1 and AQP1 were significantly related with fracture after correction for multiple testing (P < 1.6 x 10⁻⁴) and have not previously been reported associated with BMD or fracture although they both reached nominal significance (P < 0.05) in the previous GEFOS-Seq scan.
Figure 2
Figure 2. Relationship between absolute conditional and joint analysis effect size in standard deviations (y-axis) and minor allele frequency (x-axis) for 307 conditionally independent SNPs.
Red circles represent SNPs at previously reported BMD loci. Blue circles denote SNPs at novel loci. The black dashed line shows the effect size required for 80% power to detect association at a given minor allele frequency at genome-wide significance (α = 6.6x10⁻⁹) in the present study. The orange dashed line shows the effect size required for 80% power to detect association at a given minor allele frequency at genome-wide significance (α = 6.6x10⁻⁹) assuming N = 483,230 individuals when the full UKBiobank Study becomes available.
Figure 3
Figure 3. Genetic correlations between eBMD as measured in the UK Biobank Study (y-axis) and other traits and diseases (x-axis) estimated by LD score regression implemented in LDHub.
Genetic correlation (rG) and corresponding 95% confidence intervals (error bars) between eBMD and traits were estimated using linkage-disequilibrium score regression. The genetic correlation estimates (rG) are shaded according to their magnitude and direction (red for positive and blue for negative correlation).
Figure 4
Figure 4. Increased bone mass and strength in adult Glypican 6 knockout mice (Gpc6-/-)
(a) X-ray microradiography images of femur and caudal vertebrae from female wild-type (WT) and Gpc6-/- mice at postnatal day 112 (P112). Pseudocolored grey-scale images in which low bone mineral content (BMC) is green and high BMC is pink. Graphs show reference ranges derived from >250 WT mice of identical age, sex and genetic background (C57BL/6), mean (solid line), 1.0SD (dotted lines) and 2.0SD (grey box). Values for parameters from individual Gpc6-/- mice are shown as red dots and mean values as a black line (n=2 animals). (b) Micro-CT images of proximal femur trabecular bone (left) and mid-diaphysis cortical bone (right) from WT and Gpc6-/- mice. Graphs showing trabecular bone volume/tissue volume (BV/TV), trabecular number (Tb.N), trabecular thickness (Tb.Th), trabecular spacing (Tb.Sp), cortical thickness (Ct.Th), internal cortical diameter and cortical bone mineral density (BMD). (c) Representative load displacement curves from destructive 3-point bend testing of WT and Gpc6-/- femurs showing yield load, maximum load, fracture load and gradient of the linear elastic phase (stiffness). Graphs showing yield load, maximum load, fracture load, stiffness and energy dissipated prior to fracture (Toughness) (d) Representative load displacement curves from destructive compression testing of WT and Gpc6-/- caudal vertebra showing yield load, maximum load and stiffness. P values generated by permutation analysis as described in the methods. Scale bars: a,b, 1mm.

References

    1. Cauley JA, et al. Long-term risk of incident vertebral fractures. JAMA. 2007;298:2761–7. - PubMed
    1. Liu CT, et al. Heritability of prevalent vertebral fracture and volumetric bone mineral density and geometry at the lumbar spine in three generations of the Framingham study. J Bone Miner Res. 2012;27:954–8. - PMC - PubMed
    1. Estrada K, et al. Genome-wide meta-analysis identifies 56 bone mineral density loci and reveals 14 loci associated with risk of fracture. Nat Genet. 2012;44:491–501. - PMC - PubMed
    1. Zheng HF, et al. Whole-genome sequencing identifies EN1 as a determinant of bone density and fracture. Nature. 2015;526:112–7. - PMC - PubMed
    1. Arden NK, Baker J, Hogg C, Baan K, Spector TD. The heritability of bone mineral density, ultrasound of the calcaneus and hip axis length: a study of postmenopausal twins. J Bone Miner Res. 1996;11:530–4. - PubMed

Publication types

MeSH terms

Supplementary concepts