

doi: 10.1038/nmeth.4427.
Epub 2017 Sep 4.
Sampling strategies to capture single-cell heterogeneity
Affiliations
- PMID: 28869755
- PMCID: PMC5658002
- DOI: 10.1038/nmeth.4427
Item in Clipboard
Sampling strategies to capture single-cell heterogeneity
Nat Methods.
2017 Oct.
Abstract
Advances in single-cell technologies have highlighted the prevalence and biological significance of cellular heterogeneity. A critical question researchers face is how to design experiments that faithfully capture the true range of heterogeneity from samples of cellular populations. Here we develop a data-driven approach, illustrated in the context of image data, that estimates the sampling depth required for prospective investigations of single-cell heterogeneity from an existing collection of samples.
Figures
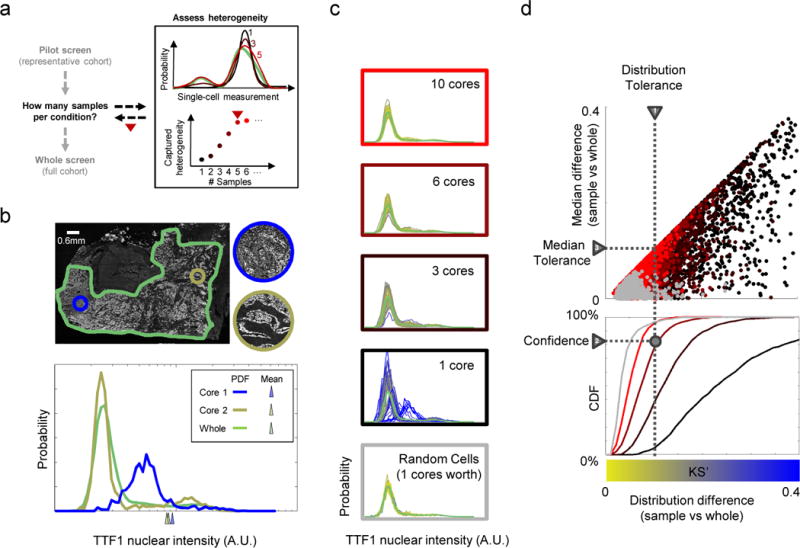
A) Overview of approach to determine how many samples (cores/replicates/draws) per condition are required for studies
of heterogeneity. Top right: distributions of cellular phenotypes from different numbers of samples; bottom right: heterogeneity
captured with different sample numbers. B) Samples that recover population averages may not capture heterogeneity.
Papillary adenocarcinoma tumor (outlined in green) shows extensive heterogeneity in the staining of TTF1, but individual cores
(circles) may not capture the full range of phenotypes. Bottom: distribution of TTF1 nuclear intensity (A.U.: arbitrary units,
x-axis is on log scale) in the whole tissue and the cores. Cores and whole tissue have similar mean intensities (triangles below
x-axis), yet differ greatly in their phenotypic distributions. C) Capturing whole-tissue heterogeneity depends on the
number of cells sampled and the nature of the sampling. Plots: histograms of TTF1 distribution generated by repeated samplings of
cells; colors based on agreement in distribution (blue or yellow show low or high (resp.) KS’ similarity) with whole tumor
distribution (green curve). A single virtual core (~1000 cells on average) is unreliable, but spatially random draws with
the same numbers of cells (bottom plot) captures heterogeneity as reliably as combining 10 virtual cores. D) Method
for determining sample numbers needed to capture whole sample heterogeneity within a specified distribution tolerance (triangle
“1”) at a desired level of confidence (triangle “2”). Upper scatter plot: comparison of whole
tissue and samples generated as in B (point colors) based on their difference in distributions (x-axis: KS’ statistic)
vs. medians (y-axis: deviation from the 50th percentile of the whole median). Differences in distributions
places bounds on familiar quantities, such as differences in medians (triangle “1”; Methods). Bottom plot:
confidence curves for achieving a desired KS’ tolerance as a function of sampling depth (number of cores) or type (core
vs. random). This process allows rational user selection of the smallest number of samples (intersection of
dotted lines) that capture whole specimen heterogeneity given desired tolerance and confidence levels. Given an existing library
of specimens, confidence curves can be analyzed to estimate sampling depths of prospectively obtained samples for each choice of
biomarker (e.g. Fig. 2C).

A–B) Evaluation of the number of 0.6mm diameter cores needed for a panel of liver cancer specimens to capture
the heterogeneity of individual whole-tissue images (with KS’ tolerance of 0.2 at 80% confidence) across different
staining/imaging parameters and biomarkers. Point location: number of cores needed for the same specimen across different
biomarker images; point size: number of specimens requiring the same numbers of cores. A) Comparison of serial
sections stained for YAP and imaged 5 months apart using different microscopes (n = 25). Deviation from the diagonal
represents the effect of imaging/staining variability. B) Comparison of the number of cores required by the most
spatially heterogeneous (YAP) and homogenous (DAPI) biomarkers on the same section (n = 25). C) Tradeoffs
between numbers of cores and sampling accuracy. Confidence curves (Online Methods; Fig. 1D
bottom) were combined across the patient cohort to predict the proportion of patients whose heterogeneity will be captured (at a
KS’ tolerance of 0.2) for different biomarkers and numbers of sampled cores (Imaging set I/II: YAP, n = 25/38;
LKB1, n = 25/-; β-catenin, n = -/38; DAPI, n = 25/38). Dotted vertical line: 3 cores, the commonly
accepted standard. D) Evaluation of the number of replicate wells needed in a high-content cell culture assay to
capture heterogeneity of different cellular features. In each of 7 replicate 384-well plates, 215 single-cell image features
(covering three imaged biomarkers) were extracted from 28 replicate wells. Features were divided (hand-curated) into feature types
(color bar), including a sub-class of low contrast intensity features (Online Methods). For each feature, we calculated the number
of wells required to ensure the distribution was close (KS’ < 0.05, 95% confidence) to the distribution
from the full set of 28 wells. Error bars represent standard deviation across the 7 replicate plates, over which this analysis was
independently repeated. Dashed horizontal line: 2 replicate wells, a common choice for high-throughput screens. The 8 rightmost
features, denoted by *, all require >20 wells (the largest value tested) in at least one replicate plate.
References
-
- Almendro V, Marusyk A, Polyak K. Cellular heterogeneity and molecular evolution in cancer. Annu Rev Pathol. 2013;8:277–302. - PubMed
-
- Wan WH, Fortuna MB, Furmanski P. A rapid and efficient method for testing immunohistochemical reactivity of monoclonal antibodies against multiple tissue samples simultaneously. Journal of immunological methods. 1987;103:121–129. - PubMed
-
- Camp RL, Neumeister V, Rimm DL. A decade of tissue microarrays: progress in the discovery and validation of cancer biomarkers. Journal of clinical oncology: official journal of the American Society of Clinical Oncology. 2008;26:5630–5637. - PubMed
MeSH terms
Substances
Grants and funding
LinkOut - more resources
Full Text Sources
Other Literature Sources
Medical
