. 2017 Sep 14;549(7671):277-281.
doi: 10.1038/nature23469. Epub 2017 Sep 6.

Neuronal regulation of type 2 innate lymphoid cells via neuromedin U

Affiliations

Neuronal regulation of type 2 innate lymphoid cells via neuromedin U

Vânia Cardoso et al. Nature. .

Abstract

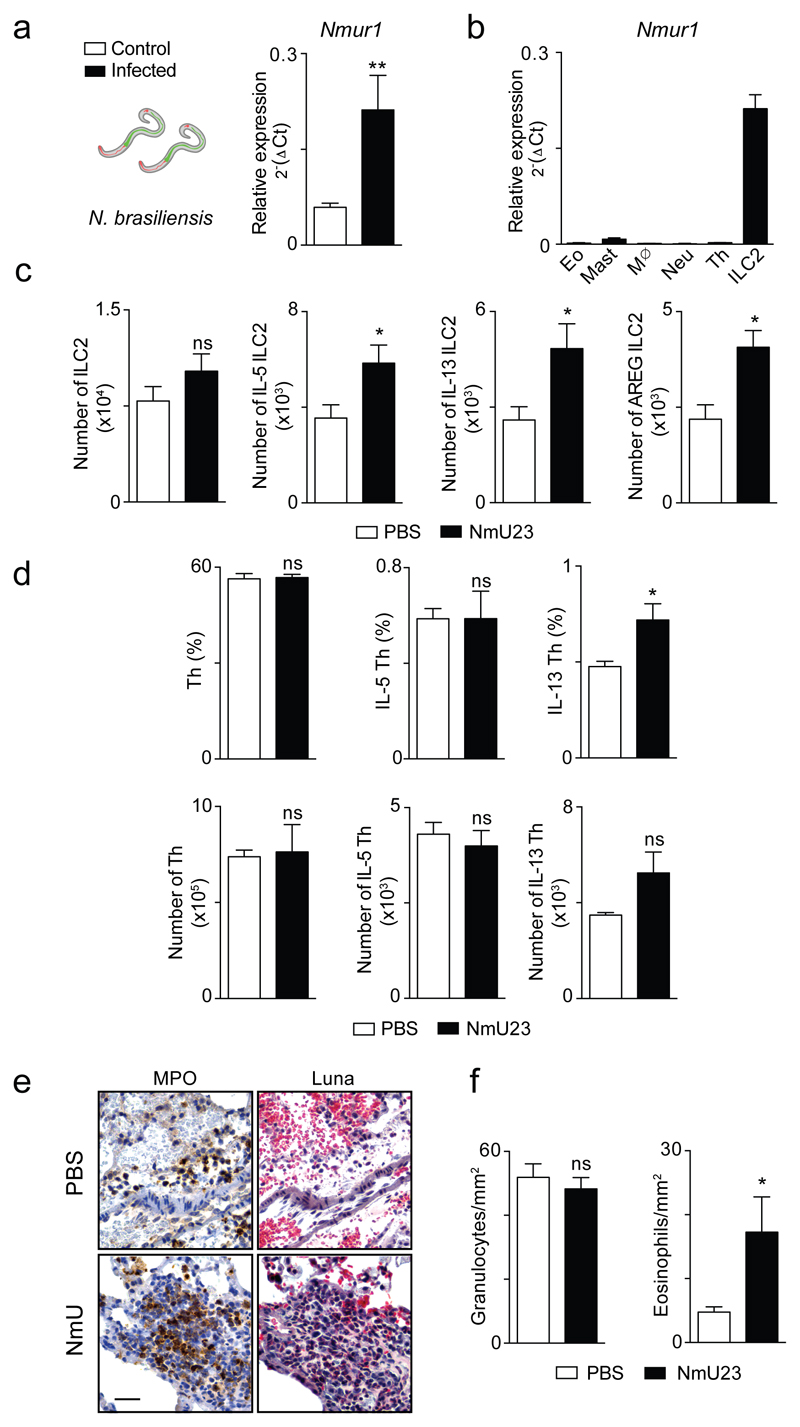
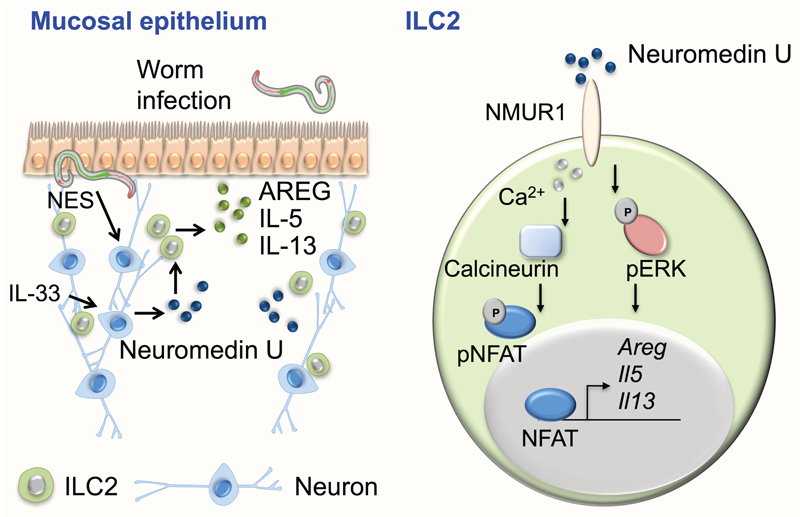
Group 2 innate lymphoid cells (ILC2s) regulate inflammation, tissue repair and metabolic homeostasis, and are activated by host-derived cytokines and alarmins. Discrete subsets of immune cells integrate nervous system cues, but it remains unclear whether neuron-derived signals control ILC2s. Here we show that neuromedin U (NMU) in mice is a fast and potent regulator of type 2 innate immunity in the context of a functional neuron-ILC2 unit. We found that ILC2s selectively express neuromedin U receptor 1 (Nmur1), and mucosal neurons express NMU. Cell-autonomous activation of ILC2s with NMU resulted in immediate and strong NMUR1-dependent production of innate inflammatory and tissue repair cytokines. NMU controls ILC2s downstream of extracellular signal-regulated kinase and calcium-influx-dependent activation of both calcineurin and nuclear factor of activated T cells (NFAT). NMU treatment in vivo resulted in immediate protective type 2 responses. Accordingly, ILC2-autonomous ablation of Nmur1 led to impaired type 2 responses and poor control of worm infection. Notably, mucosal neurons were found adjacent to ILC2s, and these neurons directly sensed worm products and alarmins to induce NMU and to control innate type 2 cytokines. Our work reveals that neuron-ILC2 cell units confer immediate tissue protection through coordinated neuroimmune sensory responses.


Conflict of interest statement

Author information

The authors declare no competing financial interests.

Figures

Extended Data Figure 1
Extended Data Figure 1. Genome-wide ILC2 transcriptional profiling and neuron-ILC2 interactions.
a, Weighted Unifrac PCoA analysis of ILC2s, Th cells, ILC1s and ILC3s. b, Levels of Nmur1 expression in ILC2s, Th cells, ILC1 and ILC3 populations. c, Nmur1 expression in lung ILC2s, Eosinophils (Eo); Mast cells (Mast); Macrophages (Mø); Neutrophils (Neu); Dendritic cells (DC); helper T (Th); B cells (B) and glial cells (G). n=3. d, Nmur2 expression in intestinal ILC2s, Eosinophils (Eo); Mast cells (Mast); Macrophages (Mø); Neutrophils (Neu); Dendritic cells (DC); helper T (Th); B cells (B), Glial cells (G); Neurons (N) and Brain (Br). n=3. e, Nmu expression in lung immune cell subsets. n=3. f, Distance of T cells and ILC2 to adjacent enteric neurons. T cells n=22; ILC2 n=28. g, Confocal analysis of lung. Red: neurons (TUBB3); Green: Thy1.2, Blue: DAPI. Green arrows: candidate ILC2s. Red arrow: neuron. Scale bar: 5μm. h, Confocal analysis of lung. Red: neurons (Chat-Cre.Rosa26RFP); Green: CD45.1, Blue: DAPI. Green arrows: candidate ILC2s. Red arrow: neuron. Scale bar: 5μm. Error bars show s.e.m. *P<0.05.
Extended Data Figure 2
Extended Data Figure 2. Neuromedin U is potent regulator of innate type 2 cytokines, via NMUR1 activation.
a, ILC2 and Th2 were activated with NmU23. ILC2 n=6; Th2 n=3. b, Proliferation (as measured by Ki67 expression) of gut ILC2 upon NmU23 activation in the presence or absence of IL-2 and IL-7 in vitro. n=3. c, Percentage ofKi67 expression in enteric ILC2 upon NmU23 administration in vivo. n=5. d, Dot plots representing Ki67 expression in gut ILC2 upon NmU23 administration in vivo. e, Lung innate type 2 cytokines after NmU23 in vitro stimulation. n=3. f, Dot plots representing lung ILC2-derived type 2 cytokines after NmU23 in vitro activation. g, Enteric ILC2-derived type 2 cytokines upon NmU23 stimulation over different incubation times or PMA+Ionomycin (P+I) activation for 4h. h, Dot plots representing gut ILC2-derived type 2 cytokines upon NmU23 stimulation over different incubation time periods. Error bars show s.e.m. *P<0.05; **P<0.01; ***P<0.001; ns not significant.
Extended Data Figure 3
Extended Data Figure 3. NMU is a fast and potent inducer of ILC2 cytokines.
a, Dot plots representing enteric ILC2-derived type 2 cytokines upon activation with increasing concentrations (10, 50 and 100ng/mL) of IL-33, IL-25 and NmU23 for 20 hours. b, Gut ILC2-derived cytokines after stimulation with increasing concentrations (10, 50 and 100ng/mL) of IL-33, IL-25, NmU23 and PMA+Ionomycin (P+I) for 4h. n=3. c, Lung ILC2- and Th cell-derived type 2 cytokines after in vivo administration of NmU23. n=3. Error bars show s.e.m. *P<0.05; **P<0.01; ns not significant.
Extended Data Figure 4
Extended Data Figure 4. Activation of ILC2s by NMU and IL-25/IL-33 signals.
a, Lung ILC2s from Il1rl1-/-Il17rb-/- (DKO) and their WT controls after NmU23 stimulation. n=6. b, Type 2 cytokines in Nmur1 sufficient and deficient ILC2s after IL-33 and IL-25 (10ng/mL) activation for 24 hours. n=3. c, Intestinal ILC2-derived cytokines after NmU23 administration in Il1rl1-/-Il17rb-/- (DKO) and their WT controls. Left panel represents ILC2 percentage gated in total live cells. n=5. d, Lung ILC2-derived cytokines in WT BALB/c and Il1rl1-/-Il17rb-/- bone marrow chimeras upon NmU23 administration. n=5. Error bars show s.e.m. *P<0.05; **P<0.01; ***P<0.001; ns not significant.
Extended Data Figure 5
Extended Data Figure 5. ILC2-autonomous NMUR1 signals.
a-d, ILC2-derived type 2 cytokines in Nmur1-/- and in their Nmur1+/+ WT littermate controls. a, Percentage of intestinal ILC2s and their signature cytokines. Nmur1+/+ n=6; Nmur1-/- n=9. b, Number of intestinal ILC2s and their signature cytokines. Nmur1+/+ n=6; Nmur1-/- n=9. c, Percentage of lung ILC2s and their signature cytokines. Nmur1+/+ n=6; Nmur1-/- n=9. d, Number of lung ILC2s and their signature cytokines. Nmur1+/+ n=6; Nmur1-/- n=9. e-h, Competitive bone marrow chimeras. 106 cells of each genotype (CD45.2) were injected intravenously in direct competition with a third-party WT competitor (CD45.1/CD45.2), in a 1:1 ratio, into non-lethally irradiated (150Rad) NSG mice (CD45.1). e, Percentage and number of donor ILC2s in the intestine. Nmur1+/+ n=8; Nmur1-/- n=6. f, Percentage and number of donor ILC2s in the lung. Nmur1+/+ n=12; Nmur1-/- n=13. g-h, Bone marrow mixed chimeras upon NmU23 administration. g, Percentage of lung Th cell-expressing type 2 cytokines. Nmur1+/+ n=5; Nmur1-/- n=4. h, Number of lung Th cell-expressing type 2 cytokines. Nmur1+/+ n=5; Nmur1-/- n=4. Error bars show s.e.m. ns not significant.
Extended Data Figure 6
Extended Data Figure 6. Calcineurin inhibition during NMU-dependent ILC2 activation.
Intestinal ILC2 activation with NmU23. Il5, Il13 and Csf2 expression in ILC2s cultured with medium (control), NmU23 or NmU23 and calcineurin inhibitor cyclosporine (CsA) (n=3). Error bars show s.e.m. ***P<0.001.
Extended Data Figure 7
Extended Data Figure 7. Neuromedin U administration during worm infection.
a-f, Mice were infected with N. brasiliensis larvae and treated with NmU23. a, Nmur1 expression in lung ILC2 at day 6 post-infection. n=6. b, Nmur1 expression in lung immune populations. Eosinophils (Eo); Mast cells (Mast); Macrophages (Mø); Neutrophils (Neu); T helper cells (Th) and ILC2. n=3. c, Number of lung ILC2s at day 1 after infection in NmU23 treated and control animals. n=5. d, Lung T helper cells at day 1 after infection in NmU23 treated and control animals. n=5. e, Myeloperoxidase (MPO)- (granulocytes) and Luna-stained (eosinophils) lung sections at day 2 after infection. f, Lung granulocyte and eosinophilic cell counts (cells/mm2) at day 2 after infection. n=8. Scale bars: 50μm. Error bars show s.e.m. *P<0.05; **P<0.01; ns not significant.
Extended Data Figure 8
Extended Data Figure 8. Worm infection in Nmur1 deficient mice.
Nmur1-/- and in their Nmur1+/+ WT littermate control mice were infected with N. brasiliensis. a, Number of lung ILC2s and their cytokines at day 6 after infection. Nmur1+/+ n=6; Nmur1-/- n=8. b, Myeloperoxidase (MPO)- (granulocytes) and Luna-stained (eosinophils) lung sections at day 2 after infection. Scale bars: 50μm. c, Lung granulocyte and eosinophil cell counts (cells/mm2) at day 2 after infection. n=8. d, Worm infection burden at day 6 and 9 post-infection in the small intestine of Nmur1 sufficient and deficient mice. D6 n=6; D9 n=5. Error bars show s.e.m. *P<0.05; **P<0.01; ***P<0.001; ns not significant.
Extended Data Figure 9
Extended Data Figure 9. Secretory worm products induce ILC2-derived type 2 cytokines.
a, ILC2-derived cytokines after stimulation with Nippostrongylus brasiliensis excretory/secretory products (NES) alone or with NES activated neurosphere-derived enteric neurons conditioned media (SN NES). Control n=3; NES n=3; SN NES n=3. b, Percentage and number of lung ILC2s and their signature cytokines after intranasal NES administration to WT mice. PBS n=5, NES n=5. Error bars show s.e.m. *P<0.05; **P<0.01; ns not significant.
Extended Data Figure 10
Extended Data Figure 10. A novel neuron-ILC2 unit orchestrated by Neuromedin U.
Mucosal neurons can directly sense worm products (NES) and the host alarmin (IL-33) to control Neuromedin U expression. Neuromedin U activates ILC2s in a cell-autonomous and NMUR1 dependent manner, resulting in a fast and potent production of inflammatory and tissue repair cytokines that confer immediate protection to worm infection. Neuromedin U activates NMUR1 inducing type 2 cytokine expression downstream of ERK phosphorylation and activation of a Ca2+/Calcineurin/NFAT cascade. This model indicates that neuron-ILC2 cell units are poised to uniquely ensure potent and immediate type 2 responses in a Neuromedin U-dependent manner.
Figure 1
Figure 1. ILC2s express NMUR1 and closely locate with NMU-expressing neurons.
a, Heat map for 40 neuronal-related mRNA transcripts in T helper cells (Th), ILC1s, ILC2s, NCR- (CD4+ and CD4-) and NCR+ ILC3s subsets. b, Comparison of ILC2 gene expression with ILC1, ILC3 NCR+ and Th cells12, by volcano plots. c, Nmur1 quantitative RT-PCR analysis in intestinal lamina propria cells unless stated otherwise. Bone marrow common lymphoid progenitor (CLP); Bone Marrow common helper innate lymphoid progenitor (CHILP); Bone marrow ILC2 progenitor (ILC2P); Mature ILC subsets; Eosinophils (Eo); Mast cells (Mast); Macrophages (Mø); Neutrophils (Neu); Dendritic cells (DC); Naïve helper T cells (Thn); Polarised Th2 cells (Th2); Memory helper T cells (Thm); B cells (B); Lamina propria glial cells (G) and Neurons (N); Epithelial cells (Ep). n=6. d, NMUR1 expression in human T helper cells and ILC2 from blood. n=3. e, Nmu expression in intestinal populations. n=6. f-g Confocal analysis of intestinal lamina propria. f, Left: Green: neurons (RetGFP); Red: CD3; Cyan: KLRG1. Right: details of the left panel. g, Red: neurons (Chat-Cre.Rosa26RFP); Green: CD3; Cyan: KLRG1. Arrows: examples of ILC2s. Scale bars: 30μm. Data are representative of 2-3 independent experiments. Error bars show s.e.m. **P<0.01.
Figure 2
Figure 2. NMU is a potent ILC2-intrinsic regulator of type 2 cytokines, via NMUR1 activation.
a-b, Type 2 cytokine gene expression in ILC2s after NmU23 activation. n=6. a, Gut ILC2s. n=6. b, Lung ILC2s. n=6. c-d, Type 2 cytokine protein expression in ILC2s after NmU23 activation. c, Intestinal ILC2s. IL-5 n=6; IL-13 n=6; AREG n=3. d, IL-5 and IL-13 expression in enteric Nmur1 competent and deficient ILC2s. e, Enteric ILC2-derived cytokines upon activation with increasing concentrations (10, 50 and 100ng/mL) of IL-33, IL-25, NmU23 and PMA+Ionomycin (P+I). n=3. f-g, in vivo administration of NmU23. f, Gut ILC2-derived type 2 cytokines. n=6. g, Intestinal Th cell-derived type 2 cytokines. n=6. h-i, BM mixed chimeras with Nmur1-/- and their Nmur1+/+ WT littermate controls upon NmU23 administration. h, Percentage of lung ILC2s. Nmur1+/+ n=5; Nmur1-/- n=4. i, Number of Iung ILC2. Nmur1+/+ n=5; Nmur1-/- n=4. Data are representative of 2-6 independent experiments. Error bars show s.e.m. *P<0.05; **P<0.01; ***P<0.001; ns not significant.
Figure 3
Figure 3. NMU regulates ILC2-derived cytokines via ERK1/2 and a Ca2+/Calcineurin/NFAT cascade.
Intestinal ILC2 activation by NMU. a, Top: p-ERK. Bottom: Percentage of p-ERK cells n=4. Mean fluorescence intensity (MFI) of p-ERK expression. n=4. b, Il5, Il13 and Csf2 expression in ILC2s cultured with medium (control), NmU23 or NmU23 and ERK inhibitor PD98059. n=3. c, Left and centre: Ca2+ influx, represented by Fluo-4 AM intensity. NmU23 was added 60 seconds after ILC2 baseline acquisition (arrow). Right: Mean intensity of Ca2+ influx. n=3. d, Il5, Il13 and Csf2 expression in ILC2s cultured with medium (control), NmU23 or NmU23 and Calcineurin inhibitor FK506. n=12. e, Nuclear translocation of NFAT (red) upon NmU23 activation in ILC2. f, Left: Percentage of ILC2 with nuclear NFAT. n=3. Right: NFAT nuclear fluorescence intensity. Control n=16; NmU23 n=7; P+I n=8. g, Il5, Il13 and Csf2 expression in ILC2s cultured with medium (control), NmU23 or NmU23 and NFAT inhibitor 11R-VIVIT. n=6. Scale bars: 5μm. Data are representative of 2-4 independent experiments. Error bars show s.e.m. *P<0.05; **P<0.01; ***P<0.001; ns not significant.
Figure 4
Figure 4. Neuron-derived NMU sets ILC2-autonomous protection against worm infection.
a, Nmu expression in total lung and gut after infection. Lung n=3; Gut n=6. b, Lung ILC2s at day 1 after infection in NmU23 treated and control animals. n=5. c, Left: Lung haemorrhage; Right: Haematoxylin and eosin (HE) lung sections at day 2 after infection. d, Eosinophil and mast cell frequencies in the bronchoalveolar lavage (BAL) at day 6 after infection. n=5. e, N. brasiliensis infection burden in: Lung phase. n=5; Intestinal phase. n=5. f-i, Nmur1-/- and their Nmur1+/+ littermate controls were infected with N. brasiliensis. f, Lung ILC2s at day 6 after infection. Nmur1+/+ n=6; Nmur1-/- n=8. g, HE lung sections 2 days after infection. h, Eosinophil and mast cell frequencies in the BAL at day 6 after infection. Nmur1+/+ n=6; Nmur1-/- n=7. i, N. brasiliensis infection burden in: Lung phase. n=3; Intestinal phase. Nmur1+/+ n=6; Nmur1-/- n=7. j-k. Nmur1-/- and Nmur1+/+ WT littermate control ILC2 chimeras. j. Lung ILC2. Nmur1+/+ n=5; Nmur1-/- n=6. k, N. brasiliensis infection burden in the intestinal phase. Nmur1+/+ n=5; Nmur1-/- n=6. l, Neurosphere-derived neuronal organoids. m, Neuron activation with NES, LPS and IL-33. WT: NES n=12; LPS n=18; IL-33 n=17. Myd88-/-: NES n=10; LPS n=15; IL-33 n=12. n, Myd88wt/fl n=3; Chat-Cre.Myd88fl/fl n=6 Scale bar: 50μm. Data are representative of 1-3 independent experiments. Error bars show s.e.m. *P<0.05; **P<0.01; ***P<0.001; ns not significant.

Comment in

References

    1. Cording S, Medvedovic J, Aychek T, Eberl G. Innate lymphoid cells in defense, immunopathology and immunotherapy. Nat Immunol. 2016;17:755–757. - PubMed
    1. Veiga-Fernandes H, Mucida D. Neuro-Immune Interactions at Barrier Surfaces. Cell. 2016;165:801–811. - PMC - PubMed
    1. Ibiza S, et al. Glial-cell-derived neuroregulators control type 3 innate lymphoid cells and gut defence. Nature. 2016;535:440–443. - PMC - PubMed
    1. Veiga-Fernandes H, Pachnis V. Neuroimmune regulation during intestinal development and homeostasis. Nat Immunol. 2017;18:116–122. - PubMed
    1. van de Pavert SA, et al. Maternal retinoids control type 3 innate lymphoid cells and set the offspring immunity. Nature. 2014;508:123–127. - PMC - PubMed

Publication types

MeSH terms