. 2017 Sep 4;18(1):165.
doi: 10.1186/s13059-017-1285-0.

Chromosome contacts in activated T cells identify autoimmune disease candidate genes

Affiliations

Chromosome contacts in activated T cells identify autoimmune disease candidate genes

Oliver S Burren et al. Genome Biol. .

Abstract

Background: Autoimmune disease-associated variants are preferentially found in regulatory regions in immune cells, particularly CD4+ T cells. Linking such regulatory regions to gene promoters in disease-relevant cell contexts facilitates identification of candidate disease genes.

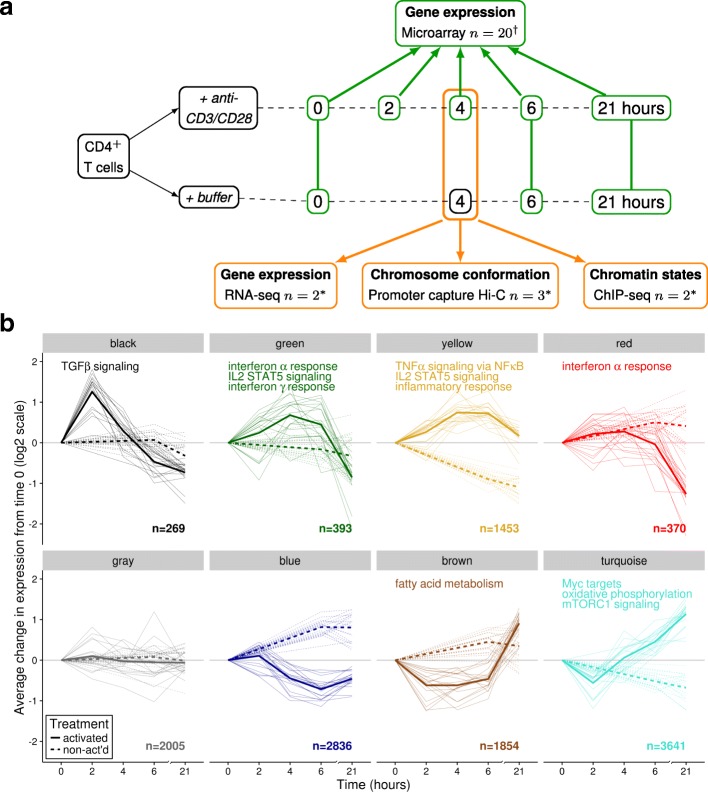
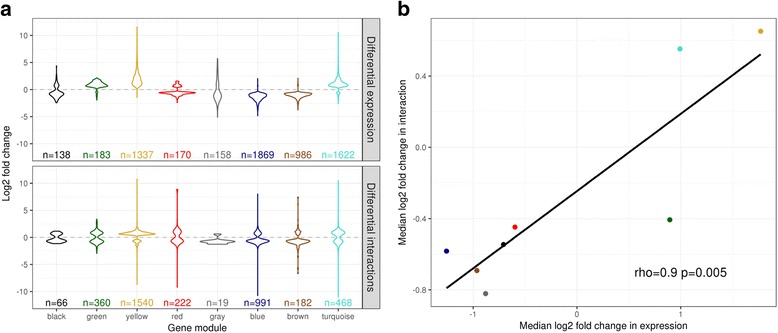
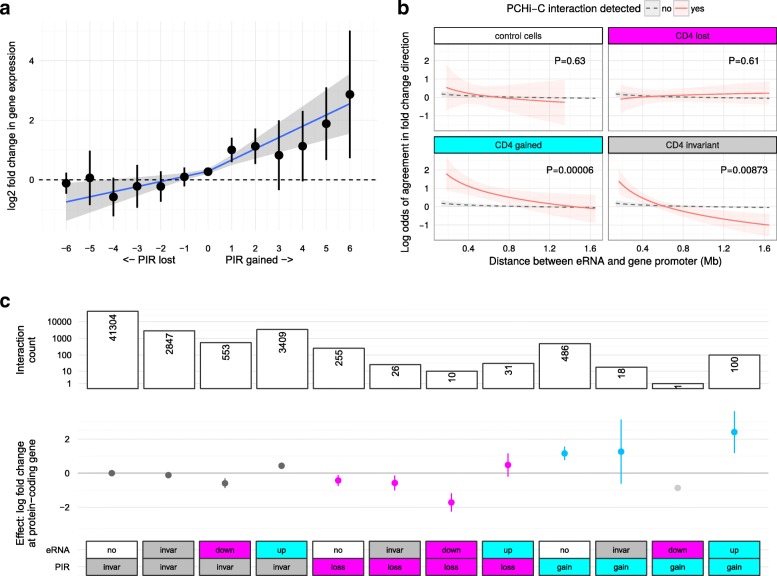
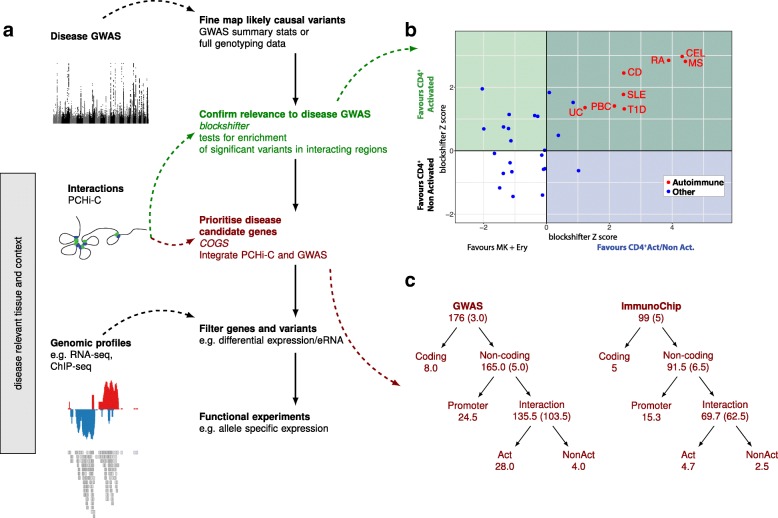
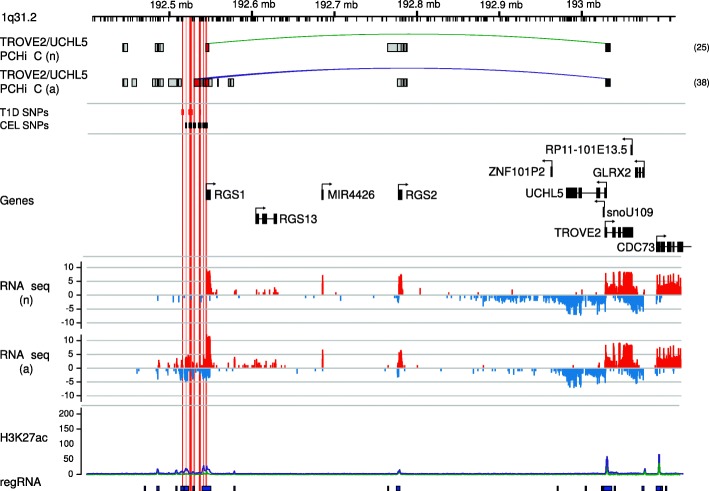
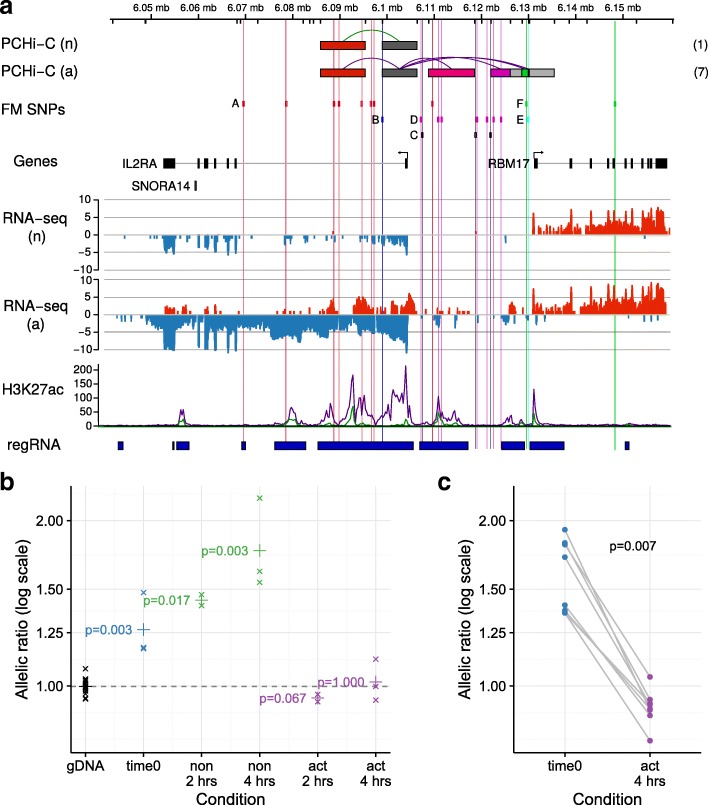
Results: Within 4 h, activation of CD4+ T cells invokes changes in histone modifications and enhancer RNA transcription that correspond to altered expression of the interacting genes identified by promoter capture Hi-C. By integrating promoter capture Hi-C data with genetic associations for five autoimmune diseases, we prioritised 245 candidate genes with a median distance from peak signal to prioritised gene of 153 kb. Just under half (108/245) prioritised genes related to activation-sensitive interactions. This included IL2RA, where allele-specific expression analyses were consistent with its interaction-mediated regulation, illustrating the utility of the approach.

Conclusions: Our systematic experimental framework offers an alternative approach to candidate causal gene identification for variants with cell state-specific functional effects, with achievable sample sizes.

Keywords: Autoimmune disease; CD4+ T cell activation; CD4+ T cells; Chromatin conformation; Genetics; Genome-wide association studies; Genomics.


Conflict of interest statement

Ethics approval and consent to participate

All samples and information were collected with written and signed informed consent. The study was approved by the local Peterborough and Fenland research ethics committee for the project entitled: ‘An investigation into genes and mechanisms based on genotype-phenotype correlations in type 1 diabetes and related diseases using peripheral blood mononuclear cells from volunteers that are part of the Cambridge BioResource project’ (05/Q0106/20). Experimental methods comply with the Helsinki Declaration.

Consent for publication

Not applicable

Competing interests

The authors declare that they have no competing interests.

Figures

Fig. 1
Fig. 1
a Summary of genomic profiling of CD4+ T cells during activation with anti-CD3/CD28 beads. We examined gene expression using microarray in activated and non-activated CD4+ T cells across 21 h and assayed cells in more detail at the 4-h time point using ChIP-seq, RNA-seq and PCHi-C. n gives the number of individuals† or pools* assayed. b Eight modules of co-regulated genes were identified and eigengenes are plotted for each individual (solid lines = activated, dashed lines = non-activated), with heavy lines showing the average eigengene across individuals. We characterised these modules by gene set enrichment analysis within the MSigDB HALLMARK gene sets; where significant gene sets were found, up to three shown per module. n is the number of genes in each module
Fig. 2
Fig. 2
Change in PCHi-C interactions correlate with change in gene expression. a Distribution of significant (FDR < 0.01) fold changes induced by activation of CD4+ T cells in (top) gene expression and (bottom) differential PCHi-C interactions for differentially expressed genes in by module. b Median significant expression and interaction fold changes by module are correlated (Spearman rank correlation)
Fig. 3
Fig. 3
PCHi-C interactions and enhancer activity predict change in gene expression. a Change in gene expression at protein coding genes (log2 fold change, y-axis) correlates with the number of PIRs gained or lost upon activation (x-axis). b Fold change at transcribed sequence within the intergenic subset of regulatory regions (‘eRNAs’) was more likely to agree with the direction of protein-coding gene fold change when the two are linked by PCHi-C (red) in activated CD4+ T cells compared to pairs of eRNA and protein-coding genes formed without regard to PCHi-C derived interactions (background, grey, p < 10−4). Interactions were categorised as control (present only in megakaryocytes and erythroblasts, our control cells), invariant (‘invar’; present in non-activated and activated CD4+ T cells), ‘loss’ (present in non-activated but not activated CD4+ T cells and significantly downregulated at FDR < 0.01) or ‘gain’ (present in activated but not non-activated CD4+ T cells and significantly upregulated at FDR < 0.01). c Gain or loss of PIRs upon activation predicts change in gene expression, with the estimated effect more pronounced if accompanied by upregulation or downregulation at an eRNA. Points show estimated effect on gene expression of each interaction and lines the 95% confidence interval. PIRs categorised as in (b). eRNAs categorised as no (undetected), invariant (‘invar’, detected in non-activated and activated CD4+ T cells, differential expression FDR ≥ 0.01), up (upregulated; FDR < 0.01) or down (downregulated; FDR < 0.01). Bar plot (top) shows the number of interactions underlying each estimate. Note that eRNA = down, PIR = gain (light gray) has only one observation so no confidence interval can be formed and is shown for completeness only
Fig. 4
Fig. 4
An experimental framework for identifying disease-causal genes. a Before prioritising genes, enrichment of GWAS signals in PCHi-C interacting regions should be tested to confirm the tissue and context are relevant to disease. Then, probabilistic fine-mapping of causal variants from the GWAS data can be integrated with the interaction data to prioritise candidate disease-causal genes, a list which can be iteratively filtered using genomic datasets to focus on (differentially) expressed genes and variants which overlap regions of open or active chromatin. b Autoimmune disease GWAS signals are enriched in PIRs in CD4+ T cells generally compared to control cells (blockshifter Z score, x-axis) and in PIRs in activated compared to non-activated CD4+ T cells (blockshifter Z score, y-axis). Text labels correspond to datasets described in Additional file 6: Table S5. c Genes were prioritised with a COGS score > 0.5 across five autoimmune diseases using genome-wide (GWAS) or targeted genotyping array (ImmunoChip) data. The numbers at each node give the number of genes prioritised at that level. Where there is evidence to split into one of two non-overlapping hypotheses (log10 ratio of gene scores > 3), the genes cascade down the tree. Act and NonAct correspond to gene scores derived using PCHi-C data only in activated or non-activated cells, respectively. Where the evidence does not confidently predict which of the two possibilities is more likely, genes are ‘stuck’ at the parent node (number given in brackets). When the same gene was prioritised for multiple diseases, we assigned fractional counts to each node, defined as the proportion of the n diseases for which the gene was prioritised at that node. Because of duplicate results between GWAS and ImmunoChip datasets, the total number of prioritised genes is 252 (see Table 1)
Fig. 5
Fig. 5
TROVE2 and UCLH5 on chromosome 1 are prioritised for CEL. The ruler shows chromosome location, with HindIII sites marked by ticks. The top tracks show PIRs for prioritised genes in non-activated (n) and activated (a) CD4+ T cells. Green and purple lines are used to highlight those PIRs containing credible SNPs from our fine-mapping. The total number of interacting fragments per PCHi-C bait is indicated in parentheses for each gene in each activation state. Dark grey boxes indicate promoter fragments; light grey boxes, PIRs containing no disease associated variants; and red boxes, PIRs overlapping fine-mapped disease-associated variants. The position of the fine-mapped variant area is indicated by red boxes and vertical red lines. Gene positions and orientation (Ensembl v75) are shown above log2 read counts for RNA-seq forward (red) and reverse (blue) strands. H3K27ac background-adjusted read count is shown in non-activated (green line) and activated (purple line) and boxes on the regRNA track show regions considered through ChromHMM to have regulatory marks
Fig. 6
Fig. 6
PCHi-C interactions link the IL2RA promoter to autoimmune disease-associated genetic variation, which leads to expression differences in IL2RA mRNA. a The ruler shows chromosome location, with HindIII sites marked by ticks. The top tracks show PIRs for prioritised genes in non-activated (n) and activated (a) CD4+ T cells. Green and purple lines are used to highlight those PIRs containing credible SNPs for the autoimmune diseases T1D and MS fine mapped on chromosome 10p15. Six groups of SNPs (A–F) highlighted in Wallace et al. [26] are shown, although note that group B was found unlikely to be causal. The total number of interacting fragments per PCHi-C bait is indicated in parentheses for each gene in each activation state. Dark grey boxes indicate promoter fragments; light grey boxes, PIRs containing no disease-associated variants; and coloured boxes, PIRs overlapping fine-mapped disease-associated variants. PCHi-C interactions link a region overlapping group A in non-activated and activated CD4+ T cells to the IL2RA promoter (dark grey box) and regions overlapping groups D and F in activated CD4+ T cells only. RNA-seq reads (log2 scale, red = forward strand, blue = reverse strand) highlight the upregulation of IL2RA expression upon activation and concomitant increases in H3K27ac (non-activated, n, green line; activated, a, purple line) in the regions linked to the IL2RA promoter. Red vertical lines mark the positions of the group A SNPs. Numbers in parentheses show the total number of IL2RA PIRs detected in each state. Here we show those PIRs proximal to the IL2RA promoter. Comprehensive interaction data can be viewed at https://www.chicp.org. b Allelic imbalance in mRNA expression in total CD4+ T cells from individuals heterozygous for group A SNPs using rs12722495 as a reporter SNP in non-activated (non) and activated (act) CD4+ T cells cultured for 2 or 4 h, compared to genomic DNA (gDNA, expected ratio = 1). Allelic ratio is defined as the ratio of counts of T to C alleles. ‘x’ = geometric mean of the allelic ratio over 2–3 replicates within each of 4–5 individuals; p values from a Wilcoxon rank sum test comparing complementary DNA (cDNA) to gDNA are shown. ‘+’ shows the geometric mean allelic ratio over all individuals. c Allelic imbalance in mRNA expression in memory CD4+ T cells differs between ex vivo (time 0) and 4-h activated samples from eight individuals heterozygous for group A SNPs using rs12722495 as a reporter SNP. p value from a paired Wilcoxon signed rank test is shown

References

    1. Maurano MT, Humbert R, Rynes E, Thurman RE, Haugen E, Wang H, et al. Systematic localization of common disease-associated variation in regulatory DNA. Science. 2012;337:1190–5. doi: 10.1126/science.1222794. - DOI - PMC - PubMed
    1. Smemo S, Tena JJ, Kim K-H, Gamazon ER, Sakabe NJ, Gómez-Marín C, et al. Obesity-associated variants within FTO form long-range functional connections with IRX3. Nature. 2014;507:371–5. doi: 10.1038/nature13138. - DOI - PMC - PubMed
    1. McGovern A, Schoenfelder S, Martin P, Massey J, Duffus K, Plant D, et al. Capture Hi-C identifies a novel causal gene, IL20RA, in the pan-autoimmune genetic susceptibility region 6q23. Genome Biol. 2016;17:212. doi: 10.1186/s13059-016-1078-x. - DOI - PMC - PubMed
    1. Xu Z, Zhang G, Duan Q, Chai S, Zhang B, Wu C, et al. HiView: an integrative genome browser to leverage Hi-C results for the interpretation of GWAS variants. BMC Res Notes. 2016;9:159. doi: 10.1186/s13104-016-1947-0. - DOI - PMC - PubMed
    1. Dryden NH, Broome LR, Dudbridge F, Johnson N, Orr N, Schoenfelder S, et al. Unbiased analysis of potential targets of breast cancer susceptibility loci by Capture Hi-C. Genome Res. 2014;24:1854–68. doi: 10.1101/gr.175034.114. - DOI - PMC - PubMed

Publication types

MeSH terms