Review
. 2017 Oct:129:207-230.
doi: 10.1016/j.biopsycho.2017.08.058. Epub 2017 Sep 14.

Psychosocial functioning and the cortisol awakening response: Meta-analysis, P-curve analysis, and evaluation of the evidential value in existing studies

Affiliations
Review

Psychosocial functioning and the cortisol awakening response: Meta-analysis, P-curve analysis, and evaluation of the evidential value in existing studies

Ian A Boggero et al. Biol Psychol. 2017 Oct.

Abstract

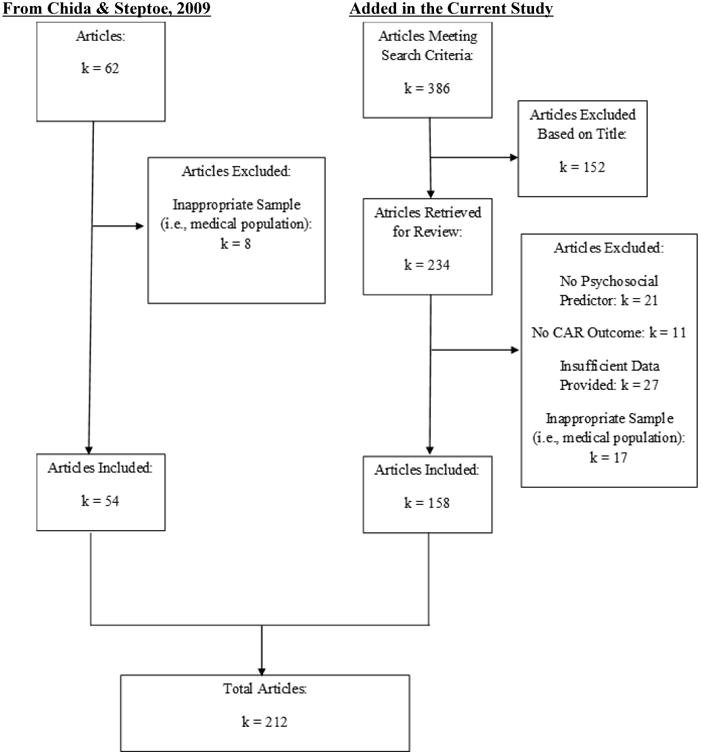
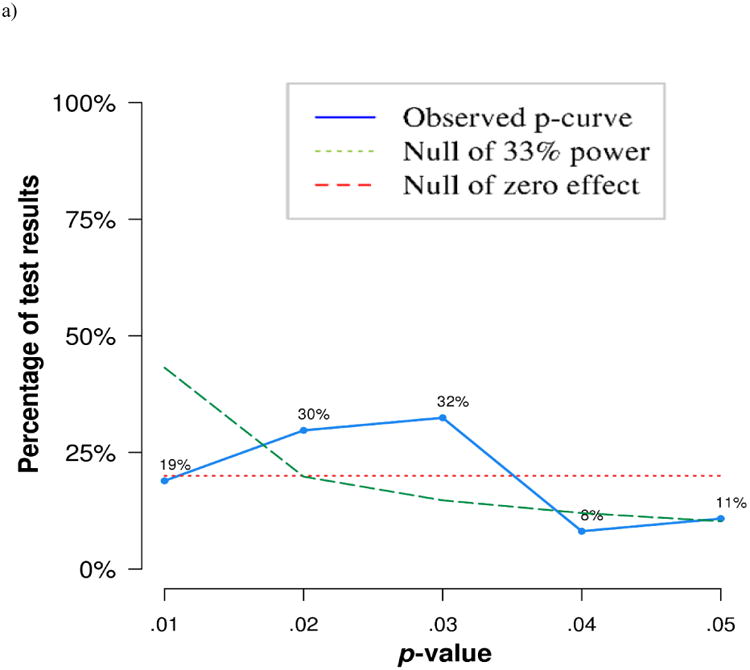
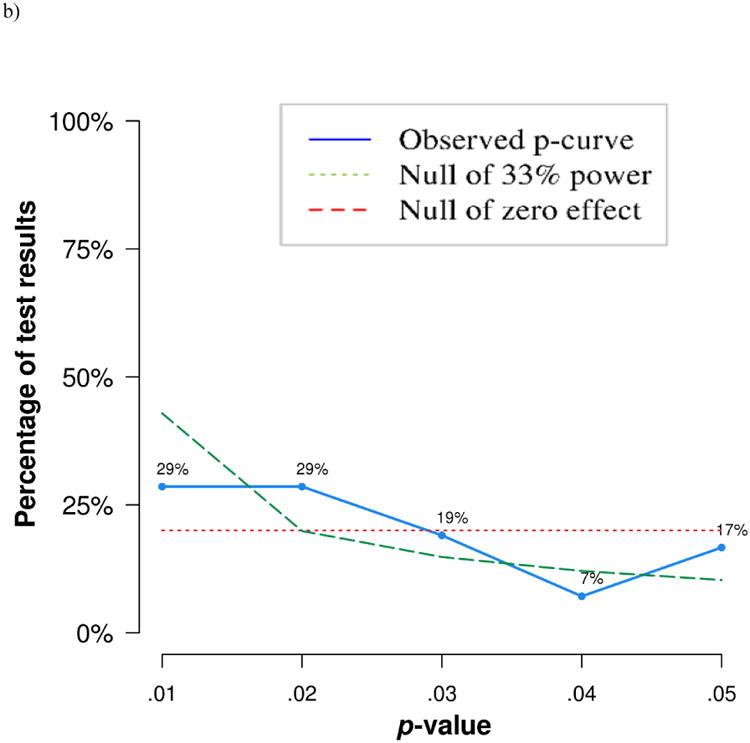
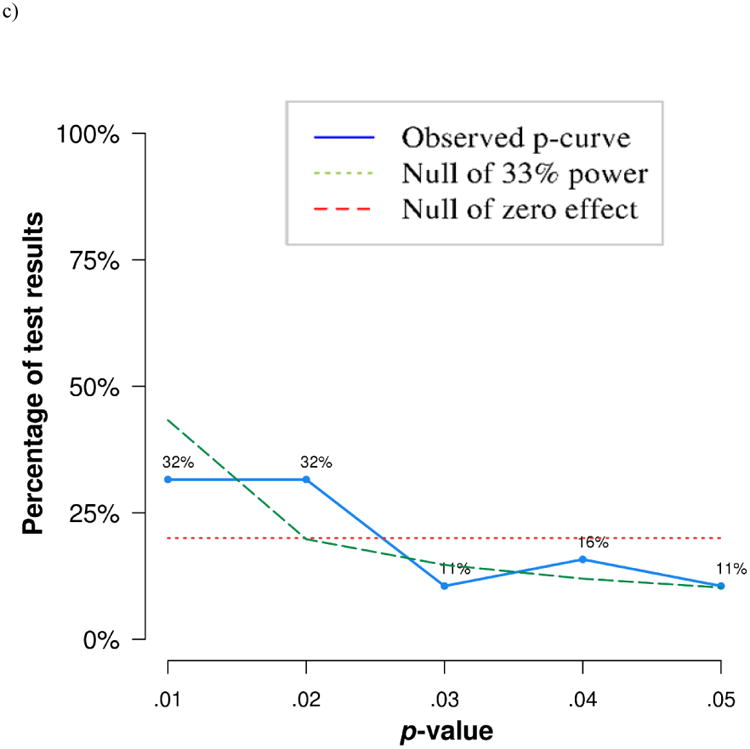
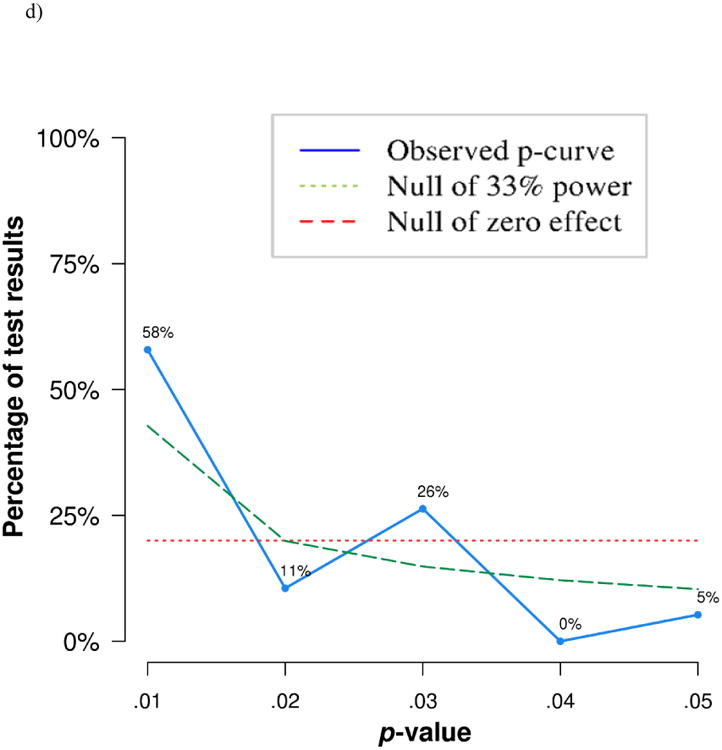
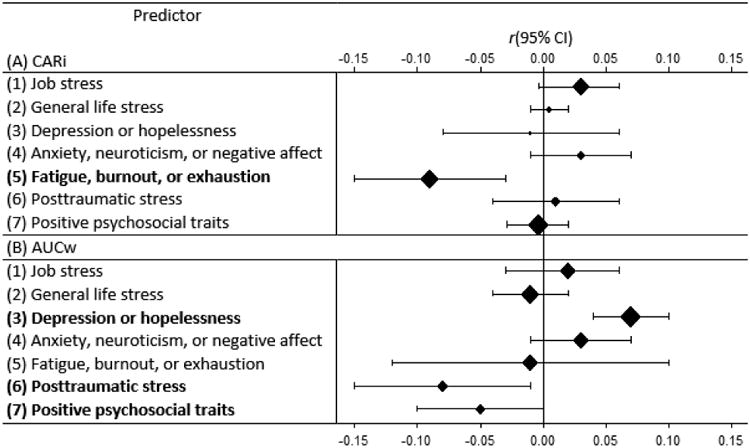
Cortisol levels rise immediately after awakening and peak approximately 30-45min thereafter. Psychosocial functioning influences this cortisol awakening response (CAR), but there is considerable heterogeneity in the literature. The current study used p-curve and meta-analysis on 709 findings from 212 studies to test the evidential value and estimate effect sizes of four sets of findings: those associating worse psychosocial functioning with higher or lower cortisol increase relative to the waking period (CARi) and to the output of the waking period (AUCw). All four sets of findings demonstrated evidential value. Psychosocial predictors explained 1%-3.6% of variance in CARi and AUCw responses. Based on these effect sizes, cross-sectional studies assessing CAR would need a minimum sample size of 617-783 to detect true effects with 80% power. Depression was linked to higher AUCw and posttraumatic stress to lower AUCw, whereas inconclusive results were obtained for predictor-specific effects on CARi. Suggestions for future CAR research are discussed.

Keywords: Depression; Endocrinology; HPA axis; Physiology; Stress.


Figures

Figure 1
Figure 1. Flow Chart of Articles Included in Study
Figure 2
Figure 2. P-curves of Findings Relating the CAR to Psychosocial Functioning
Worse psychosocial functioning with higher CARi Worse psychosocial functioning with lower CARi W orse psychosocial functioning with higher AUCw Worse psychosocial functioning with lower AUCw Notes: To compute p-curves, directionality for all predictors was changed so that higher values reflected worse psychosocial functioning. To test for evidential value, the p-curve calculator compares observed p-values to p-values that would be obtained if the null were true (i.e., a null hypothesis of zero effect, as shown with the red line). The blue line shows the observed p-curve from significant p-values. If studies contain evidential value, the blue line will be right-skewed. Flat blue lines (neither right nor left skewed) indicate that findings lack evidential value or are underpowered to detect evidential value. These alternatives are differentiated by testing the set of findings against a null of 33%, shown in the green line. For detailed explanation of p-curves, see Simonsohn et al., 2014.
Figure 3
Figure 3. Combined Effect Sizes by Predictor Type
Notes: Forest plot displays predictor-specific associations with both CARi and AUCw. For each association, the aggregate effect size r is shown with its 95% confidence interval. Solid diamonds represent the aggregate effects in relation to zero and the size of the diamonds is proportional to the variance of the combined effect size from the random-effects meta-analysis. Aggregate effects that are significantly different from zero (CIs do not overlap with zero) are highlighted in bold font in the left column.

References

    1. Adam EK. Transactions among adolescent trait and state emotion and diurnal and momentary cortisol activity in naturalistic settings. Psychoneuroendocrinology. 2006;31:664–679. doi: 10.1016/j.psyneuen.2006.01.010. - DOI - PubMed
    1. Adam EK, Hawkley LC, Kudielka BM, Cacioppo JT. Day-to-day dynamics of experience-cortisol associations in a population-based sample of older adults. Proceedings of National Academy of Science. 2006;103:17058–17063. doi: 10.1073/pnas.0605053103. - DOI - PMC - PubMed
    1. Alderling M, Theorell T, de la Torre B, Lundberg I. The demand control model and circadian saliva cortisol variations in a Swedish population based sample (the PART study) BMC Public Health. 2006;6:1–8. doi: 10.1186/1471-2458-6-288. - DOI - PMC - PubMed
    1. Armario A, Marti O, Molina T, De Pablo J, Valdes M. Acute stress markers in humans: response of plasma glucose, cortisol and prolactin to two examinations differing in the anxiety they provoke. Psychoneuroendocrinology. 1996;21(1):17–24. doi: http://dx.doi.org/10.1016/0306-4530(95)00048-8. - DOI - PubMed
    1. Aubry JM, Jermann F, Gex-Fabry M, Bockhorn L, Van der Linden M, Gervasoni N, et al. Bondolfi G. The cortisol awakening response in patients remitted from depression. Journal of Psychiatric Research. 2010;44(16):1199–1204. doi: 10.1016/j.jpsychires.2010.04.015. - DOI - PubMed

MeSH terms