. 2017 Sep 4;7(1):10338.
doi: 10.1038/s41598-017-09449-x.

Human Primary Bone Marrow Mesenchymal Stromal Cells and Their in vitro Progenies Display Distinct Transcriptional Profile Signatures

Affiliations

Human Primary Bone Marrow Mesenchymal Stromal Cells and Their in vitro Progenies Display Distinct Transcriptional Profile Signatures

Roshanak Ghazanfari et al. Sci Rep. .

Abstract

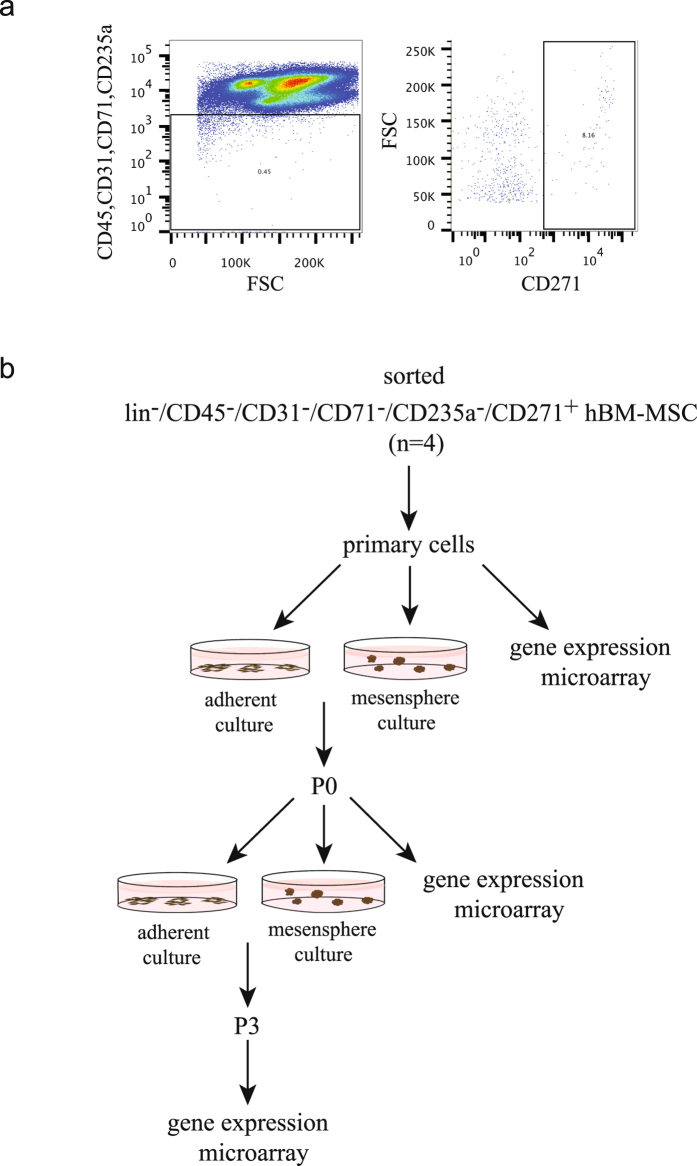
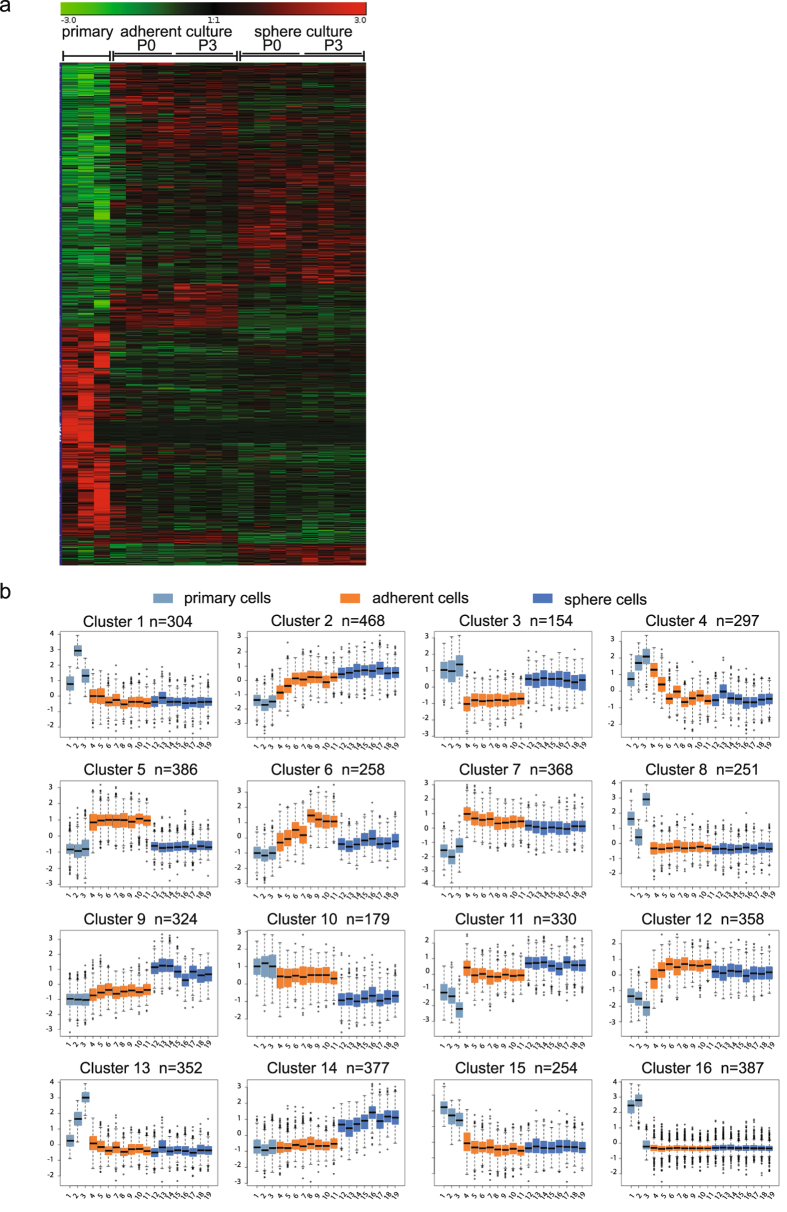
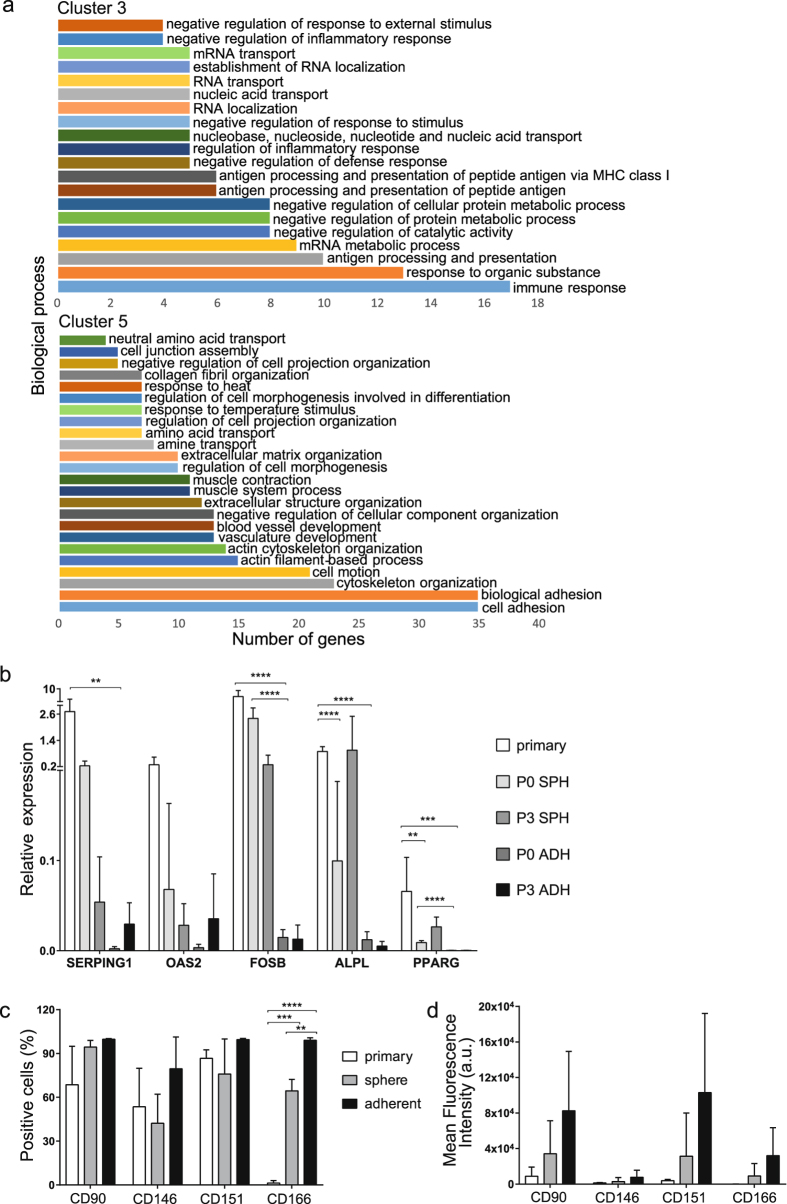
Bone marrow mesenchymal stromal cells (BM-MSCs) are a rare population of cells that gives rise to skeletal tissues and the hematopoietic stroma in vivo. Recently, we have demonstrated that BM-MSCs fulfill stringent in vivo stem cell criteria when propagated as non-adherent mesenspheres but not as adherent-cultured cells. Motivated by these profound functional differences, the current study aimed to identify potential important MSC regulators by investigating global gene expression profiles of adherent and non-adherent culture-derived BM-MSCs in comparison with primary BM-MSCs. A substantial number of genes were differentially expressed between primary and culture-expanded cells already early upon culture, and numerous genes were found to be different when comparing adherent and non-adherent BM-MSCs. Cluster analysis identified 16 sets of genes of which two displayed comparable gene expression levels in primary and non-adherent cultured cells, but not in adherent cultured cells. This pattern suggested that these clusters contained candidate regulators of BM-MSCs. Gene expression differences were confirmed for selected genes and BM-MSC transcription factors by protein analysis and RT-PCR, respectively. Taken together, these data demonstrated profound gene expression changes upon culture of primary BM-MSCs. Moreover, gene cluster differences provide the basis to uncover the regulatory mechanisms that control primary and cultured BM-MSCs.


Conflict of interest statement

The authors declare that they have no competing interests.

Figures

Figure 1
Figure 1
FACS gating strategy and experimental design of the microarray analysis. a. Freshly isolated, lineage-depleted bone marrow mononuclear cells were stained with antibodies against CD45, CD31, CD71, CD235a and CD271 as described. Following forward/side scatter gating and dead cell exclusion, CD45/CD31/CD71/CD235a cells were sorted by gating on the CD271+ population. A representative set of FACS plots is presented. b. Schematic overview of the experimental workflow. From each donor (n = 4), primary cells were sorted into lysis buffer for gene expression analysis, and for culture in mesensphere and standard MSC medium, respectively. Ex-vivo cultured adherent BM-MSCs and mesenspheres were harvested in passages 0 and 3, and prepared for microarray analysis.
Figure 2
Figure 2
Gene expression and cluster analysis of primary, adherent and non-adherent culture-expanded BM-MSCs. (a) Heatmap of significantly differentially expressed genes in primary, adherent and sphere cultured-derived lin/CD45/CD31/CD71/CD235a/CD271+ cells at passages 0 and 3. (b) Cluster analysis of differentially expressed genes. The first data points from the left in each plot (1–3, light blue) represent primary cells, the next 8 boxes in orange represent adherent cultured cells (4–7: passage 0; 8–11: passage 3) and the last 8 boxes in dark blue represent the results for sphere cultured cells (12–15: passage 0, 16–19: passage 3).
Figure 3
Figure 3
Primary and sphere-cultured cells but not adherent cultured cells show similar expression patterns in clusters 3 and 5. (a) Biological process annotations with false discovery rate (FDR) ≤ 0.1% in clusters 3 and 5 were identified using the DAVID Bioinformatics Resources 6.8. The x-axis indicates the number of genes included in each functional group. Cluster 3 shows the genes that were up-regulated in primary and sphere-cultured cells, but down-regulated in adherent-cultured cells. Cluster 5 contains genes that were down-regulated in primary and sphere-cultured cells but up-regulated in adherent-cultured cells. The names of the genes in clusters 3 and 5 are listed in Supplementary Table S1. (b) Gene expression analysis of cluster 3 genes relative to the RPL11 reference gene (n = 3). Significant differences in gene expression between primary and cultured cells (P0 and P3) are indicated as: **p < 0.01, ***p < 0.001, ****p ≤ 0.0001 (2-way ANOVA, multiple comparisons test). (c) Percentage of positive cells for each surface marker in primary, adherent and sphere cultured BM-MSCs (n = 3, 2-way ANOVA, p = 0.0005), and (d) Mean fluorescence intensity (geometric means) of each surface marker minus their respective isotype (n = 3, 2-way ANOVA p = 0.55, cell group variation p = 0.0149, surface marker variation p = 0.1027). Bars show mean ± SD. SPH: sphere cultured cells, ADH: adherent cultured cells.

References

    1. Tormin A, et al. Characterization of bone marrow-derived mesenchymal stromal cells (MSC) based on gene expression profiling of functionally defined MSC subsets. Cytotherapy. 2009;11:114–128. doi: 10.1080/14653240802716590. - DOI - PubMed
    1. Pevsner-Fischer M, Levin S, Zipori D. The origins of mesenchymal stromal cell heterogeneity. Stem Cell Rev. 2011;7:560–568. doi: 10.1007/s12015-011-9229-7. - DOI - PubMed
    1. Qian H, Le Blanc K, Sigvardsson M. Primary mesenchymal stem and progenitor cells from bone marrow lack expression of CD44 protein. The Journal of biological chemistry. 2012;287:25795–25807. doi: 10.1074/jbc.M112.339622. - DOI - PMC - PubMed
    1. de Almeida DC, et al. Epigenetic Classification of Human Mesenchymal Stromal Cells. Stem Cell Reports. 2016;6:168–175. doi: 10.1016/j.stemcr.2016.01.003. - DOI - PMC - PubMed
    1. Reinisch A, et al. Epigenetic and in vivo comparison of diverse MSC sources reveals an endochondral signature for human hematopoietic niche formation. Blood. 2015;125:249–260. doi: 10.1182/blood-2014-04-572255. - DOI - PMC - PubMed

Publication types