

A comparative integrated gene-based linkage and locus ordering by linkage disequilibrium map for the Pacific white shrimp, Litopenaeus vannamei
- PMID: 28871114
- PMCID: PMC5583237
- DOI: 10.1038/s41598-017-10515-7
A comparative integrated gene-based linkage and locus ordering by linkage disequilibrium map for the Pacific white shrimp, Litopenaeus vannamei
Abstract
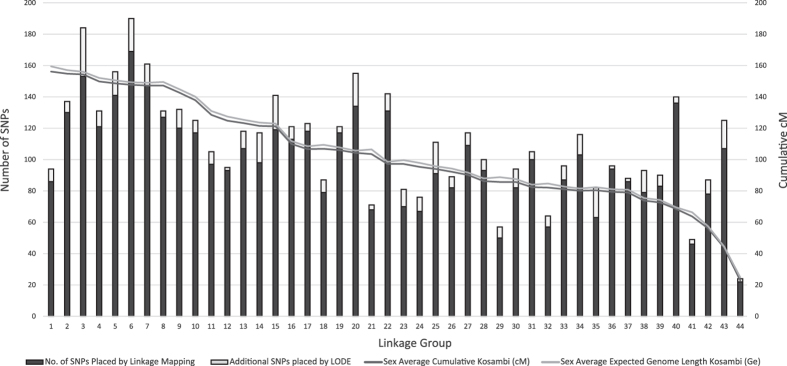
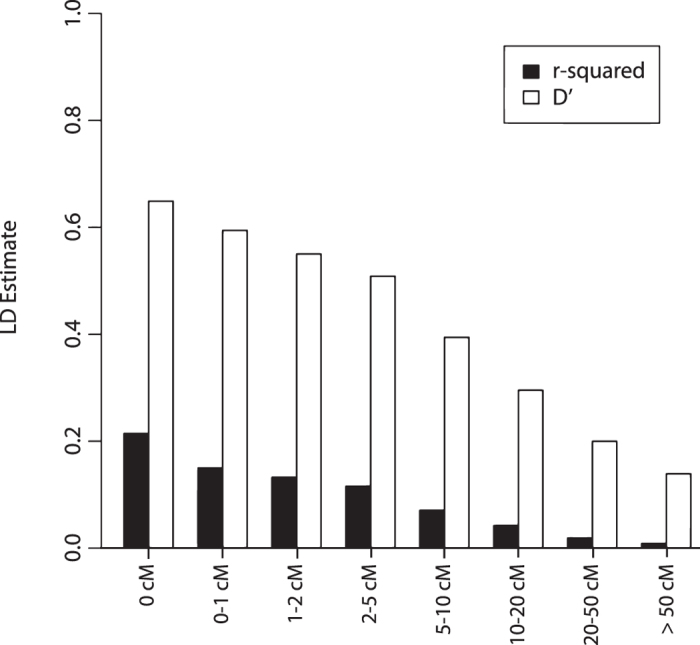
The Pacific whiteleg shrimp, Litopenaeus vannamei, is the most farmed aquaculture species worldwide with global production exceeding 3 million tonnes annually. Litopenaeus vannamei has been the focus of many selective breeding programs aiming to improve growth and disease resistance. However, these have been based primarily on phenotypic measurements and omit potential gains by integrating genetic selection into existing breeding programs. Such integration of genetic information has been hindered by the limited available genomic resources, background genetic parameters and knowledge on the genetic architecture of commercial traits for L. vannamei. This study describes the development of a comprehensive set of genomic gene-based resources including the identification and validation of 234,452 putative single nucleotide polymorphisms in-silico, of which 8,967 high value SNPs were incorporated into a commercially available Illumina Infinium ShrimpLD-24 v1.0 genotyping array. A framework genetic linkage map was constructed and combined with locus ordering by disequilibrium methodology to generate an integrated genetic map containing 4,817 SNPs, which spanned a total of 4552.5 cM and covered an estimated 98.12% of the genome. These gene-based genomic resources will not only be valuable for identifying regions underlying important L. vannamei traits, but also as a foundational resource in comparative and genome assembly activities.
Conflict of interest statement
The authors declare that they have no competing interests.
Figures

References
-
- Yue GH. Recent advances of genome mapping and marker-assisted selection in aquaculture. Fish Fish. 2014;15:376–396. doi: 10.1111/faf.12020. - DOI
-
- Argue BJ, Arce SM, Lotz JM, Moss SM. Selective breeding of Pacific white shrimp (Litopenaeus vannamei) for growth and resistance to Taura Syndrome Virus. Aquaculture. 2002;204:447–460. doi: 10.1016/S0044-8486(01)00830-4. - DOI
Publication types
MeSH terms
LinkOut - more resources
Full Text Sources
Other Literature Sources
