. 2017 Sep 4;7(1):10397.
doi: 10.1038/s41598-017-10929-3.

Small molecule T63 suppresses osteoporosis by modulating osteoblast differentiation via BMP and WNT signaling pathways

Affiliations

Small molecule T63 suppresses osteoporosis by modulating osteoblast differentiation via BMP and WNT signaling pathways

Xiao-Li Zhao et al. Sci Rep. .

Abstract

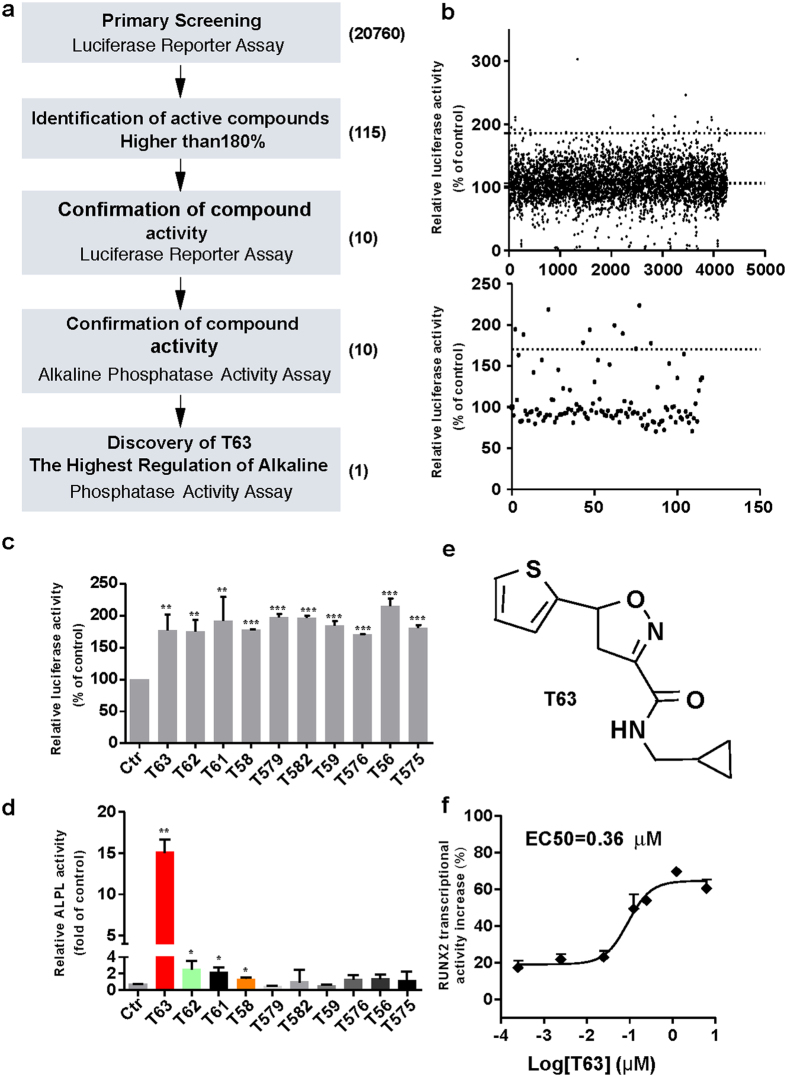
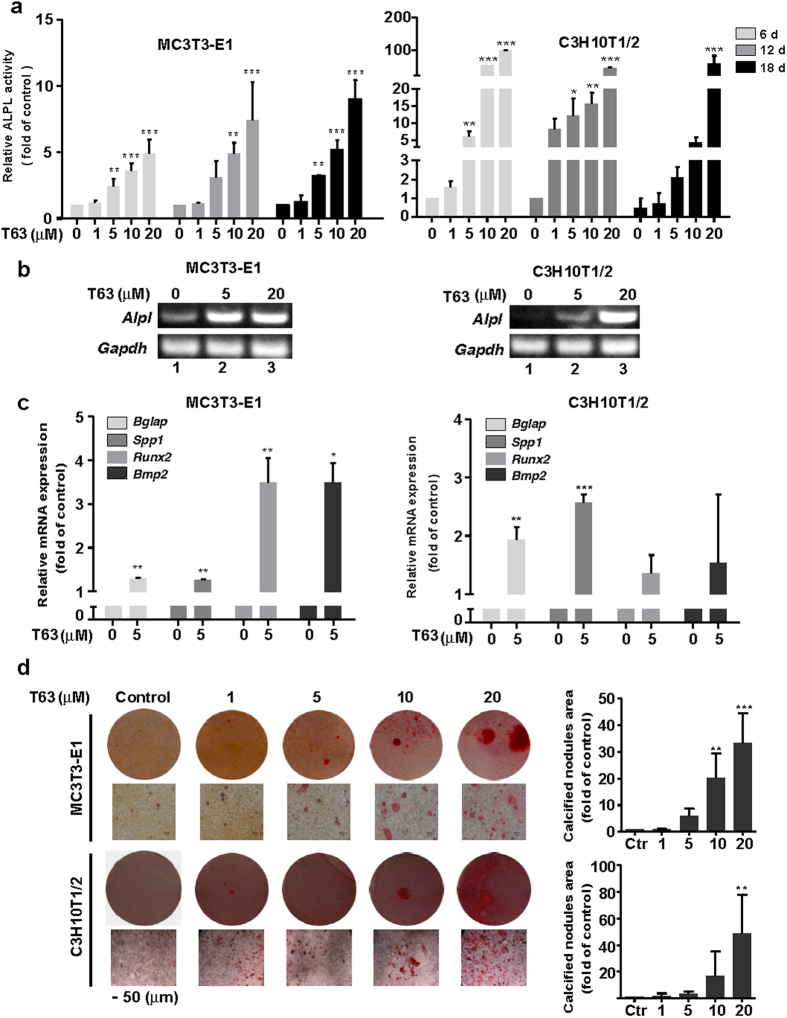
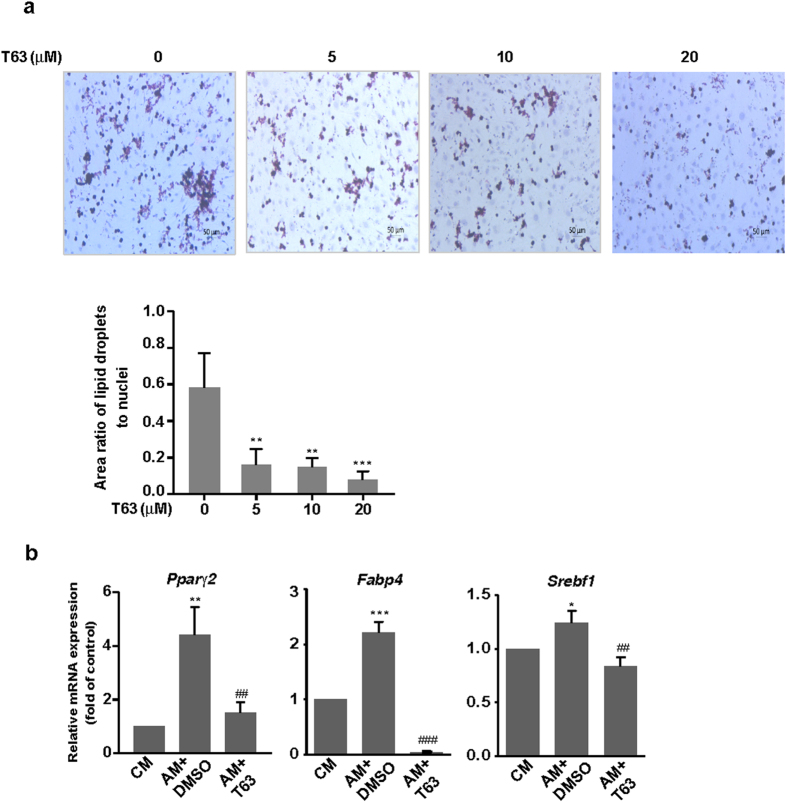
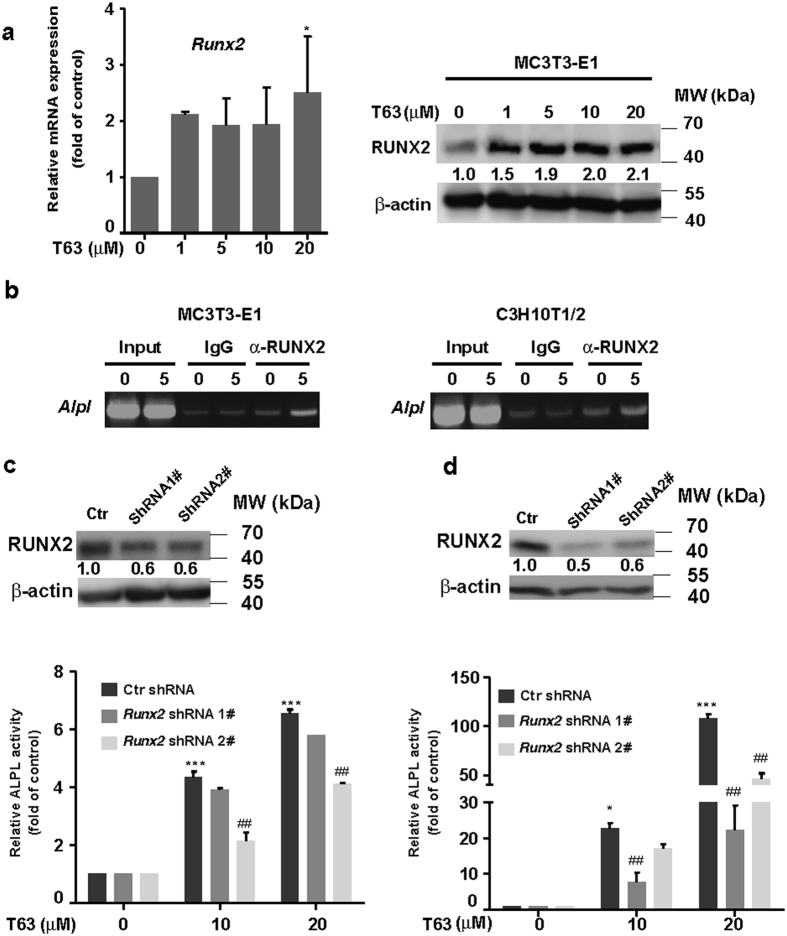
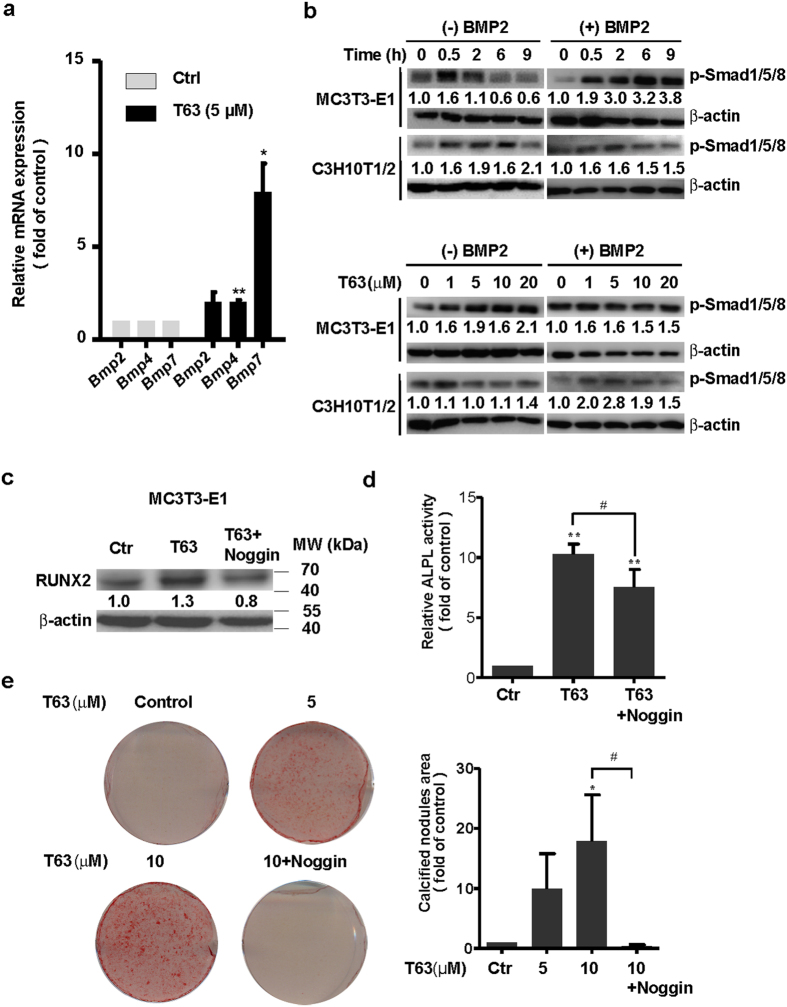
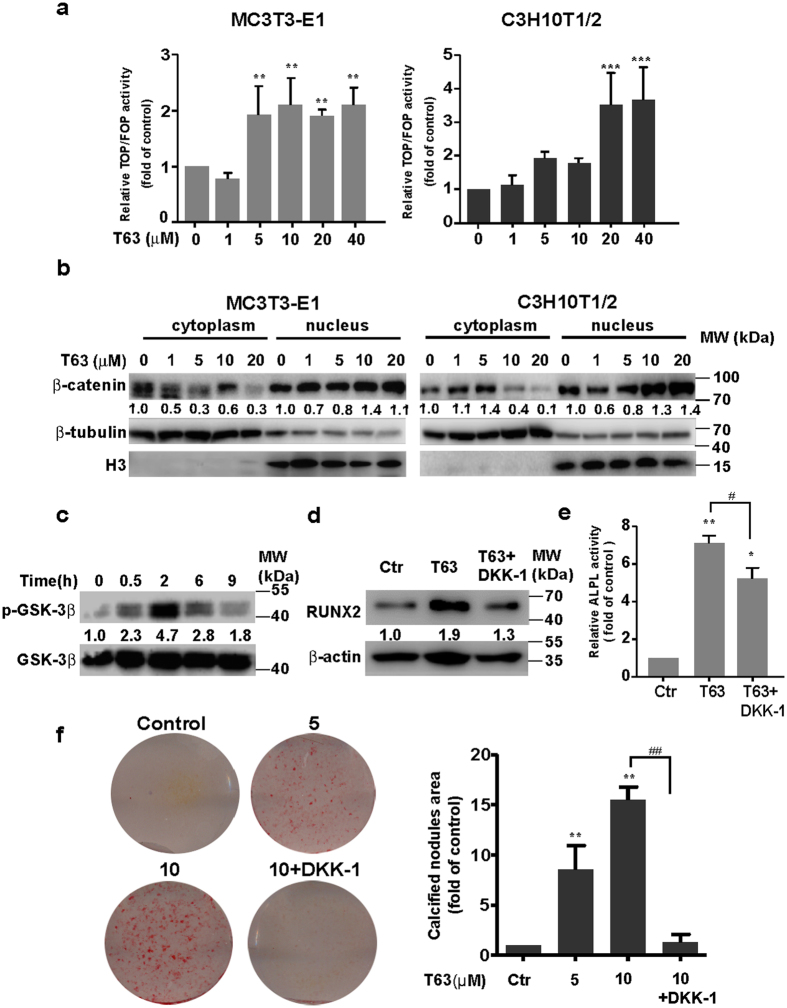
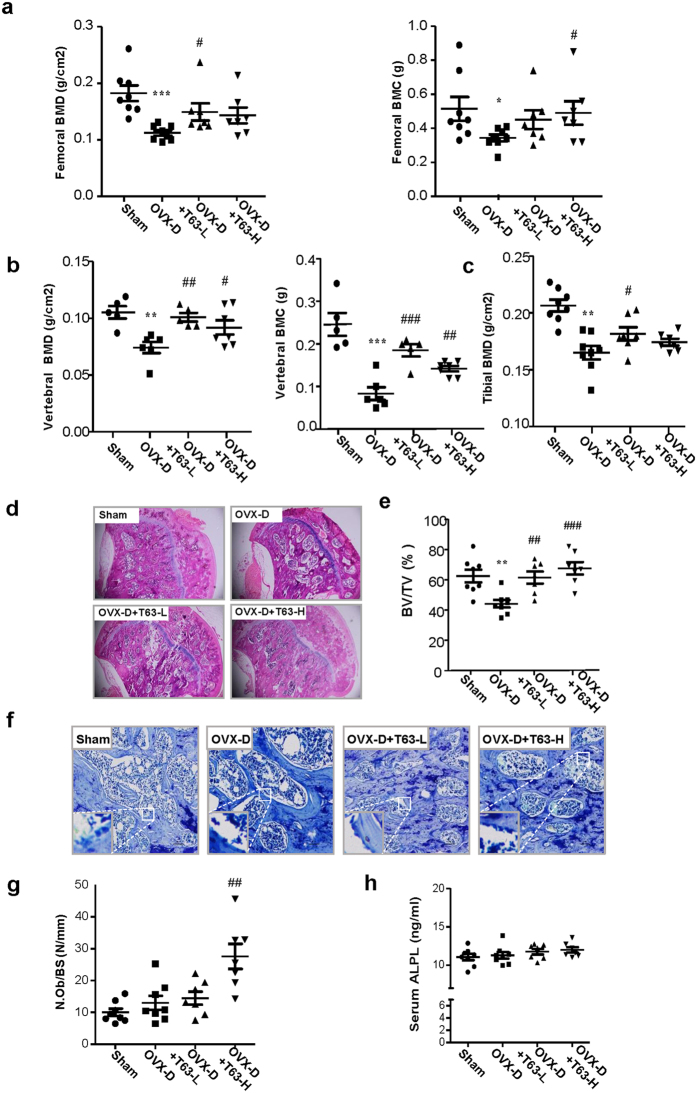
Osteoporosis results from the imbalance between bone resorption and bone formation, and restoring the normal balance of bone remodeling is highly desirable for identification of better treatment. In this study, using a cell-based high-throughput screening model representing Runt-related transcription factor 2 (RUNX2) transcriptional activity, we identified a novel small-molecular-weight compound, T63, as an efficient up-regulator of osteogenesis. T63 increased the alkaline phosphatase (ALPL) activity and mineralization as well as gene expression of Alpl and other osteogenic marker genes in mouse osteoblasts and mesenchymal stem cell-like cells. Upon induction of osteoblast differentiation, T63 inhibited adipogenic differentiation in the pluripotent mesenchymal cells. Consistently, T63 up-regulated RUNX2 mRNA and protein levels, and knockdown of RUNX2 reduced the osteogenic role of T63. Mechanistically, T63 activated both BMPs and WNT/β-catenin signaling pathways. Inhibition of either signaling pathway with specific inhibitor suppressed T63-induced RUNX2 expression and the osteogenic phenotypes. Moreover, T63 markedly protected against bone mass loss in the ovariectomized and dexamethasone treated rat osteoporosis model. Collectively, our data demonstrate that T63 could be a promising drug candidate and deserves further development for potential therapeutics in osteoporosis.


Conflict of interest statement

The authors declare that they have no competing interests.

Figures

Figure 1
Figure 1
Identification of T63 by high-throughput screening. (a) Flow chart of the screening procedure. (b) Upper panel: Scatter plot of the first round luciferase-dependent screening in MC3T3-E1-OSE cells. Lower panel: 115 compounds selected for the second round screening. (c and d) RUNX2 transcriptional activities and ALPL activity of the ten hits (n = 3). *p < 0.05, **p < 0.01, **p < 0.001 versus control. (e) Structure of compound T63. (f) EC50 curve and value of T63. MC3T3-E1-OSE cells were treated with different concentrations of T63 for 48 h and luciferase activity was measured. EC50 curve and value was performed by Graphpad prism 5 (n = 3).
Figure 2
Figure 2
T63 increases osteoblast differentiation in MC3T3-E1 and C3H10T1/2 cells. (a) ALPL activity. MC3T3-E1 (left panel) or C3H10T1/2 (right panel) cells were cultured in OS medium, and treated with different concentrations of T63 for the indicated time before subjected to ALPL assay. *p < 0.05, **p < 0.01, ***p < 0.001 versus respective control (n = 4). (b) T63 increased Alpl mRNA expression. The cells were treated with T63 for 12 days and Alpl mRNA was analyzed by semi-quantitative PCR. Full-length gels are shown in Supplementary Fig. S6a. (c) Effect of T63 on the mRNA expression of Bglap, Spp1, Runx2 and Bmp2. The cells were treated with T63 (5 μM) for 12 days before qRT-PCR. *p < 0.05, **p < 0.01, ***p < 0.001 versus control (n = 3). (d) Osteoblast mineralization. The cells were cultured in OS medium and treated with T63 for 21 days before Alizarin Red S staining (Scale bar: 50 μm). The quantitation of calcified nodules were shown as means ± SD, **p < 0.01, ***p < 0.001 versus control (n = 3).
Figure 3
Figure 3
T63 inhibits the adipogenic differentiation of C3H10T1/2 cells. (a) Representative images of liqid droplets formation. C3H10T1/2 cells were cultured in the adipogenic medium and treated with T63 for 9 days before Oil Red O staining (Scale bar: 50 μm). The area ratios of lipid droplets to nuclei were quantitated. **p < 0.01, ***p < 0.001 versus control (n = 3). (b) Effect of T63 on the mRNA expressions of Pparγ2, Srebf1 and Fabp4. C3H10T1/2 cells were cultured in adipogenic medium in the presence or absence of 5 μM T63 for 6 days before qRT-PCR analysis. CM: complete medium; AM: adipogenic medium. *p < 0.01, **p < 0.01, ***p < 0.001 versus CM control, ## p < 0.01, ### p < 0.001 versus AM control (n = 3).
Figure 4
Figure 4
The osteogenic role of T63 is dependent on RUNX2 expression. (a) Expression of RUNX2 mRNA and protein. MC3T3-E1 cells were treated with T63 for 48 h, and mRNA (left) and protein level (right) was determined by qRT-PCR and western blot, respectively. *p < 0.05 versus control (n = 3). (b) T63 increased the enrichment of RUNX2 on the promoter region of Alpl analyzed by ChIP assay. (c and d) Depletion of Runx2 suppressed T63-induced ALPL activity. MC3T3-E1 (c) or C3H10T1/2 (d) cells were transfected with Runx2 shRNA for 6 h, followed by T63 treatment for 6 days before subjected to ALPL assay. *p < 0.05, ***p < 0.001 versus drug free control. ## p < 0.01 versus respective control shRNA group (n = 3). Knockdown efficiency of Runx2 shRNAs was shown in the upper panels. Full-length blots and gels are shown in Supplementary Figs S5 and S6.
Figure 5
Figure 5
T63 activates BMPs/Smad1/5/8 pathway. (a) Expression of Bmp2, Bmp4 and Bmp7 genes. MC3T3-E1 cells were treated with T63 (5 μM) for 48 h before qRT-PCR analysis (n = 3). *p < 0.05, **p < 0.01 versus control. (b) Activation of p-Smad1/5/8 in both dose- and time-dependent manner in the presence or absence of BMP2. The cells were treated with T63 (5 μM) as indicated (upper panels), or with the indicated concentration for 0.5 h (lower panels) in the presence or absence of BMP2 (50 ng/ml), followed by western blot analysis. Relative optical density for each band was quantified, normalized and labeled under each lane. (c) Noggin decreased RUNX2 protein level. MC3T3-E1 cells were treated with T63 (5 μM) in the presence or absence of Noggin (200 ng/ml) for 48 h, and subjected to western blot analysis (n = 3). (d) Noggin decreased T63-induced ALPL activity. MC3T3-E1 cells were treated with Noggin (200 ng/ml) in the presence of T63 (10 μM) for 6 days and the ALPL activity was measured. **p < 0.01 versus control, # p < 0.05 between both groups (n = 3). (e) Noggin decreased T63-induced mineralization. MC3T3-E1 cells were treated with the indicated compounds for 18 days before subjected to Alizarin Red S staining, and the quantification of calcified nodules were plotted as means ± SD (n = 3). *p < 0.05 versus control, # p < 0.05 between both groups. Full-length blots are shown in Supplementary Fig. S5.
Figure 6
Figure 6
T63 activates canonical WNT/β-catenin pathway. (a) T63 increased TCF/LEF reporter activity at 48 h. **p < 0.01, ***p < 0.001 versus respective control (n = 3). (b) The levels of β-catenin expression in the nucleus and cytoplasm after treatment with T63 for 48 h. (c) MC3T3-E1 cells were treated with T63 (5 µM) as indicated, and the levels of phosphorylated and total GSK-3β proteins were measured. (d) DKK-1 decreased RUNX2 protein level. MC3T3-E1 cells were treated with T63 (5 μM) in the presence or absence of DKK-1 (200 ng/ml) for 48 h before western blot analysis. (e) DKK-1 decreased ALPL activity. MC3T3-E1 cells were co-treated with T63 (10 μM) and DKK-1 (200 ng/ml) for 6 days in OS medium and ALPL activity was measured. *p < 0.05, **p < 0.01 versus control, # p < 0.05 between both groups (n = 3). (f) DKK-1 impaired the mineralization. MC3T3-E1 cells were cultured in OS medium and treated as indicated for 21 days, and the quantification of calcified nodules were plotted as means ± SD (n = 3). **p < 0.01 versus control, ## p < 0.01 between both groups. Full-length blots are shown in Supplementary Fig. S5.
Figure 7
Figure 7
T63 attenuates bone mass loss in OVX-D rat osteoporosis model. (a,b) BMD and BMC of the right femur and lumbar vertebrae. *p < 0.05, **p < 0.01, ***p < 0.001 versus Sham group, # p < 0.05, ## p < 0.01, ### p < 0.001 versus OVX-D group. (c) BMD of the right tibia. **p < 0.01 versus respective Sham group, # p < 0.05 versus OVX-D group. (D) Femoral H&E staining (×5 magnification). (e) Bone histomorphometric analysis of bone volume fraction (BV/TV%). **p < 0.01 versus Sham group. ## p < 0.01, ### p < 0.001 versus OVX-D group. (f) Femoral toluidine blue staining (Scale bar: 100 μm). (g) The numbers of osteoblasts (N.Ob) per millimeter of trabecular bone surface (BS) were counted. ## p < 0.01 versus OVX-D group. (h) Serum ALPL level.

References

    1. Yu B, Wang C-Y. Osteoporosis: The Result of an ‘Aged’ Bone Microenvironment. Trends in Molecular Medicine. 2016;22:641–644. doi: 10.1016/j.molmed.2016.06.002. - DOI - PMC - PubMed
    1. Chen JS, Sambrook PN. Antiresorptive therapies for osteoporosis: a clinical overview. Nat Rev Endocrinol. 2012;8:81–91. doi: 10.1038/nrendo.2011.146. - DOI - PubMed
    1. Komori T. Regulation of osteoblast differentiation by transcription factors. J Cell Biochem. 2006;99:1233–1239. doi: 10.1002/jcb.20958. - DOI - PubMed
    1. James AW. Review of Signaling Pathways Governing MSC Osteogenic and Adipogenic Differentiation. Scientifica (Cairo). 2013;2013 - PMC - PubMed
    1. Almalki SG, Agrawal DK. Key transcription factors in the differentiation of mesenchymal stem cells. Differentiation. 2016;92:41–51. doi: 10.1016/j.diff.2016.02.005. - DOI - PMC - PubMed

Publication types

MeSH terms