. 2017 Sep 4;8(1):424.
doi: 10.1038/s41467-017-00479-7.

Editing an α-globin enhancer in primary human hematopoietic stem cells as a treatment for β-thalassemia

Affiliations

Editing an α-globin enhancer in primary human hematopoietic stem cells as a treatment for β-thalassemia

Sachith Mettananda et al. Nat Commun. .

Abstract

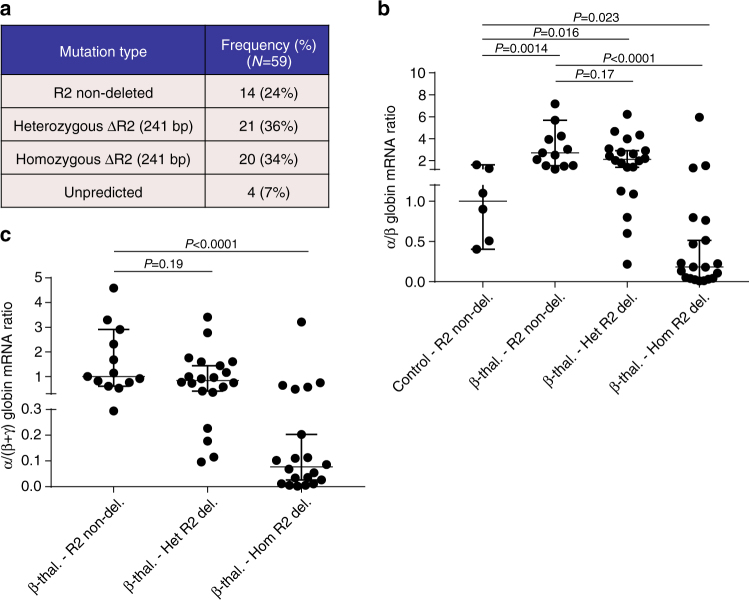
β-Thalassemia is one of the most common inherited anemias, with no effective cure for most patients. The pathophysiology reflects an imbalance between α- and β-globin chains with an excess of free α-globin chains causing ineffective erythropoiesis and hemolysis. When α-thalassemia is co-inherited with β-thalassemia, excess free α-globin chains are reduced significantly ameliorating the clinical severity. Here we demonstrate the use of CRISPR/Cas9 genome editing of primary human hematopoietic stem/progenitor (CD34+) cells to emulate a natural mutation, which deletes the MCS-R2 α-globin enhancer and causes α-thalassemia. When edited CD34+ cells are differentiated into erythroid cells, we observe the expected reduction in α-globin expression and a correction of the pathologic globin chain imbalance in cells from patients with β-thalassemia. Xenograft assays show that a proportion of the edited CD34+ cells are long-term repopulating hematopoietic stem cells, demonstrating the potential of this approach for translation into a therapy for β-thalassemia.β-thalassemia is characterised by the presence of an excess of α-globin chains, which contribute to erythrocyte pathology. Here the authors use CRISP/Cas9 to reduce α-globin expression in hematopoietic precursors, and show effectiveness in xenograft assays in mice.


Conflict of interest statement

The authors declare no competing financial interests.

Figures

Fig. 1
Fig. 1
Characterization of a rare natural mutation ((αα)ALT) confined to MCS-R2. a Kindred showing patient (MC) homozygous for the (αα)ALT mutation and his heterozygote daughters. b Hemoglobin level and red cell parameters of MC and RC (who is heterozygous for the (αα)ALT mutation). c Peripheral blood smear, Giemsa stained, from patient MC, which shows anisocytosis and poikilocytosis with some irregularly contracted cells; scale bar represents 10 μm. d Peripheral blood Hemoglobin H (HbH) preparation, brilliant cresyl blue stained, from patient MC, which shows HbH inclusions; scale bar represents 10 μm. e Southern blot analysis using a probe specific for the core of MCS-R2, which gives an 19 kb band on BglII digest genomic DNA from normal controls and RC but not from MC confirming the absence of this segment. f, g Analysis of enrichment of histone 4 (H4) acetylation f and SCL g by ChIP-qPCR in in vitro differentiated primary erythroid cells (Fibach culture) of MC harvested at intermediated erythroblasts stage (day 8–10 of Phase 2). The y-axis represents enrichment relative to ChIP input, normalized to 18S control region. Mean values are presented and error bars represent SD (n = 3). Amplicons are labeled thus: RHBDF1, intronic amplicon within the Rhomboid gene RHBDF1, used as a negative control; ALT insert, amplicon specific for 39 bp insert; MCS-R1, the human MCS-R1 which is one of the other enhancers of α-globin; alpha-promoter, α-globin promoter; beta actin promoter, a control amplicon over the β-actin promoter. h Analysis of the abundance of panH4 acetylation across the α-globin locus by ChIP-seq in in vitro differentiated primary erythroid cells harvested at intermediated erythroblasts stage from patient MC (lower track) and a normal control (upper track), showing the absence of the peak over MCS-R2 in patient MC (red dashed box)
Fig. 2
Fig. 2
Deletion of MCS-R2 using CRISPR/Cas9 genome editing in human CD34+ cells. a Schematic of sgRNA target sites. Four sgRNAs (Cr1, Cr2, Cr9, and Cr10) were designed to target the 5′ end of the MCS-R2 core element, whereas three sgRNAs (Cr7, Cr8, and Cr12) target the 3′ end. b Representative flow cytometry plots showing GFP expression and forward scatter (FS) after gating for live cells in non-transfection control (NTC), Cas9 control (C9), and CRISPR/Cas9 plasmid pair-transfected cells. Orange: GFP negative, blue: GFP positive (low), and green: GFP positive (high). Mean and SD of the percentage of cells within each region is indicated (n = 3). Gating strategy is shown in Supplementary Fig. 10a. c Representative gel electrophoresis image of genomic DNA extracted from cells targeted by four CRISPR/Cas9 plasmid pairs analyzed by PCR. d Gene editing deletion induction efficiency as measured independently by percentages of mutated alleles determined by band size in end-point PCR and subsequent Sanger sequence analysis and by determining inverse of proportions of amplicons inside: outside deletion (amplicons of same length) by multiplexed droplet digital PCR; mean values are presented and error bars represent SD (n = 3). e Characterization of deletion break points by sequencing (co-ordinates from Hum Mar 2006 (NCBI36/hg18) assembly). f α-and β-globin gene expression normalized to the expression of RPL13A and α/β-globin mRNA ratios relative to Cas9 control (C9) analyzed by qPCR; error bars represent SD (n = 3); *P < 0.05 and **P < 0.01 relative to C9 (Student’s t-test). C9 Cas9-only control
Fig. 3
Fig. 3
Single-cell clone analysis of targeted deletion of MCS-R2. a Gel electrophoresis image of genomic DNA from 48 individual single-cell clones genome-edited using CRISPR pair Cr2 and Cr12 (from three biological independent donors) analyzed by PCR. The amplicon from the wild-type allele is 613 bp and the mutated amplicon is 372 bp. Clones are numbered 51–98 and clone 59 failed to amplify. Extended genotype analysis of these clones by sequencing is presented in Supplementary Fig. 4. b Frequency of different types of mutations generated. c α/β-globin mRNA ratios of individual clones of erythroid cells which are non-deleted (R2 non-del) (n = 6) and heterozygous (Het R2 del.) (n = 13) or homozygous (Hom R2 del.) (n = 21) for a 241 bp deletion of MCS-R2 region analyzed by qPCR; median (horizontal bar) and 95% confidence interval (error bar) are shown and P-values were calculated using Mann–Whitney U-test. d α/β-globin mRNA ratios of erythroid cells, which has no deletion (n = 6), heterozygous deletion (n = 13), homozygous deletion (n = 21), and inversion (n = 3) of MCS-R2 analyzed by qPCR. Means and SEM are shown. e Meta-plot of all off-target loci for CRISPR pair Cr2 and Cr12. All captured sites are plotted on the same x-axis, showing ±100 bases from each potential off-target site. Counts deviating from the reference sequence, which are normalized to 10,000 counts are plotted in the y-axis. The values are means of the libraries where each library is a pool of five independent clones. The shaded violet area denotes ±1000 counts and only data over this threshold were considered as off-target. Error bars represent SEM for each base at each locus. Potential off-target hits for Cr2 and Cr12 (condition) are plotted alongside those of a control group (control). The numbers are annotated in Supplementary Table 4. All of the variations from the reference sequence were shown to be known SNPs or indels or novel variations common to both control and condition and therefore unrelated to potential off-target activity
Fig. 4
Fig. 4
Xenograft assay. a Schematic of the workflow of mouse xenograft experiment. b Flow cytometry analysis of cells following CRISPR transfection demonstrating transfected (positive for GFP) CD34+ HSPCs. Gating strategy is shown in Supplementary Fig. 10b. c Flow cytometry plots of harvested bone marrow from xenograft mice gated for live cells demonstrating hCD45 expression. Gating strategy is shown in Supplementary Fig. 10c. d Gel electrophoresis image of genomic DNA extracted from human cells obtained from xenograft mouse analyzed by PCR demonstrating genome-edited bands. e Characterization of deletion break points by sequencing (co-ordinates from Hum Mar 2006 (NCBI36/hg18) Assembly) f Morphological analysis of hematopoietic colonies grown in methyl cellulose which were generated by HSCs harvested from secondary transplant mice (two independent mice)
Fig. 5
Fig. 5
Deletion of MCS-R2 in CD34+ cells from HbE β-thalassemia patients using Cr2 + Cr12. a Frequency of different types of mutations generated. b α/β-globin mRNA ratios of individual clones of erythroid cells which are non-deleted normal control (n = 6), non-deleted HbE β-thalassemia (n = 13), HbE β-thalassemia heterozygous for the deletion of MCS-R2 (n = 20), and HbE β-thalassemia homozygous for the deletion of MCS-R2 (n = 20) analyzed by qPCR; median (horizontal bar) and 95% confidence interval (error bar) are shown and P-values were calculated using Mann–Whitney U-test. c Data for α/(β + γ) globin mRNA ratios for individual clones of HbE β-thalassemia erythroid cells grouped according to genotype and normalized to median of non-deleted HbE β-thalassemia clones; median (horizontal bar) and 95% confidence interval (error bar) are shown and P-values were calculated using Mann–Whitney U-test

References

    1. Higgs DR, Engel JD, Stamatoyannopoulos G. Thalassaemia. Lancet. 2012;379:373–383. doi: 10.1016/S0140-6736(11)60283-3. - DOI - PubMed
    1. Weatherall D. J. & Clegg J. B. in The Thalassaemia Syndromes, 4 edn (Blackwell Science, 2001).
    1. Mettananda S, Gibbons RJ, Higgs DR. Alpha-Globin as a molecular target in the treatment of beta-thalassemia. Blood. 2015;125:3694–3701. doi: 10.1182/blood-2015-03-633594. - DOI - PMC - PubMed
    1. Sollaino MC, et al. Association of alpha globin gene quadruplication and heterozygous beta thalassemia in patients with thalassemia intermedia. Haematologica. 2009;94:1445–1448. doi: 10.3324/haematol.2009.005728. - DOI - PMC - PubMed
    1. Premawardhena A, et al. A novel molecular basis for beta thalassemia intermedia poses new questions about its pathophysiology. Blood. 2005;106:3251–3255. doi: 10.1182/blood-2005-02-0593. - DOI - PubMed

Publication types