. 2017 Aug 21:8:596.
doi: 10.3389/fphys.2017.00596. eCollection 2017.

Comparative Analysis for Glycopatterns and Complex-Type N- Glycans of Glycoprotein in Sera from Chronic Hepatitis B- and C-Infected Patients

Affiliations

Comparative Analysis for Glycopatterns and Complex-Type N- Glycans of Glycoprotein in Sera from Chronic Hepatitis B- and C-Infected Patients

Xinmin Qin et al. Front Physiol. .

Abstract

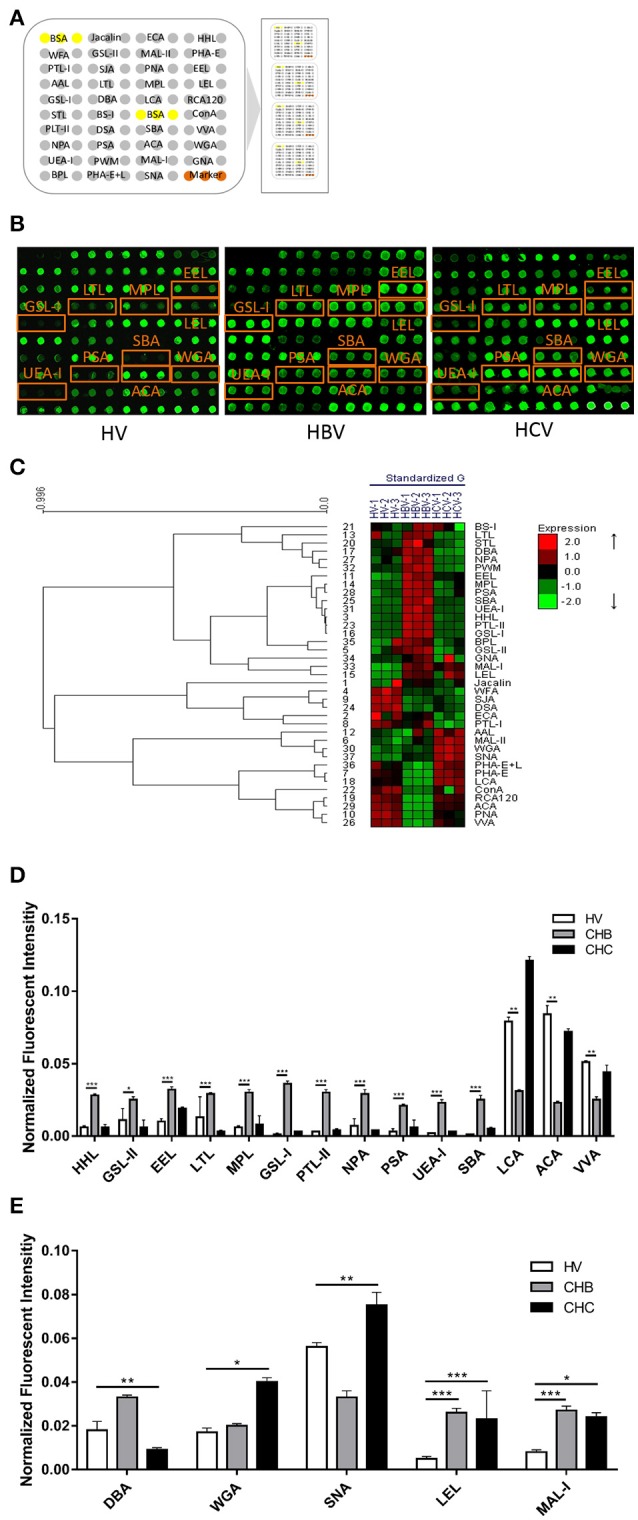
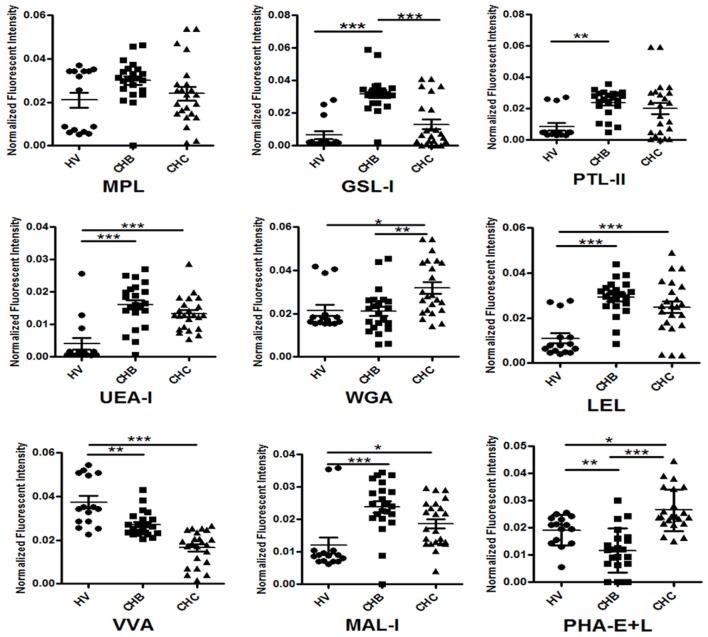
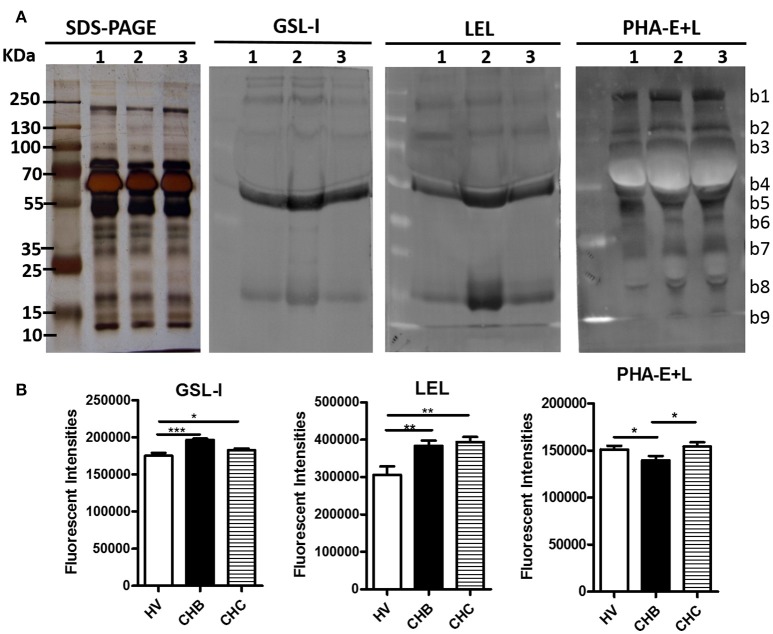
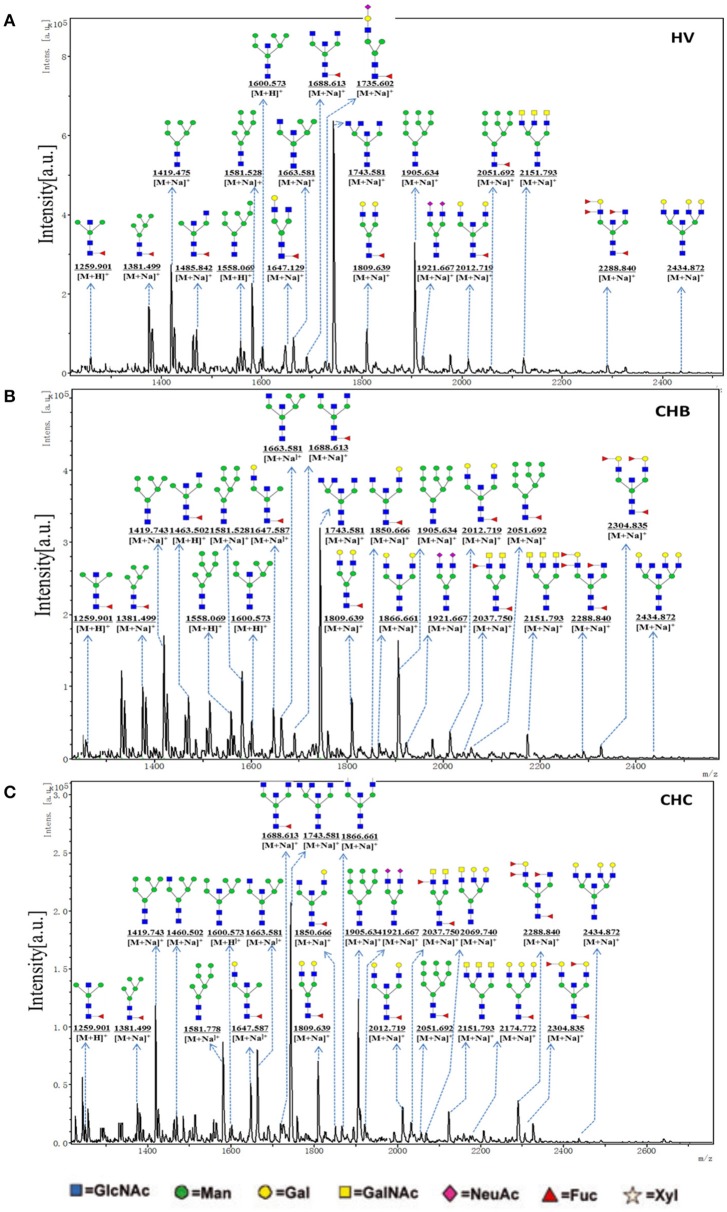
Background: Chronic infection with HBV (CHB) or HCV (CHC) is the most common chronic viral hepatitis that can lead to cirrhosis and hepatocellular carcinoma in humans, their infections have distinct pathogenic processes, however, little is known about the difference of glycoprotein glycopatterns in serum between hepatitis B virus (HBV)- and hepatitis C virus (HCV)-infected patients. Methods: A method combining the lectin microarrays, letin-mediated affinity capture glycoproteins, and MALDI-TOF/TOF-MS was employed to analyze serum protein glycopatterns and identify the glycan structures from patients with CHB (n = 54) or CHC(n = 47), and healthy volunteers (HV, n = 35). Lectin blotting was further utilized to validate and assess the expression levels of their serum glycopatterns. Finally, the differences of the glycoprotein glycopatterns were systematically compared between CHB and CHC patients. Conclusions: As a result, there were 11 lectins (e.g., HHL, GSL-II, and EEL) exhibited significantly increased expression levels, and three lectins (LCA, VVA, and ACA) exhibited significantly decreased expression levels of serum protein glycopatterns only in the CHB patients. However, DBA exhibited significantly decreased expression levels, and two lectins (WGA and SNA) exhibited significantly increased expression levels of serum glycopatterns only in the CHC patients. Furthermore, LEL and MAL-I showed a coincidentally increasing trend in both CHC and CHB patients compared with the HV. The individual analysis demonstrated that eight lectins (MPL, GSL-I, PTL-II, UEA-I, WGA, LEL, VVA, and MAL-I) exhibited a high degree of consistency with the pooled serum samples of HV, CHB, and CHC patients. Besides, a complex-type N-glycans binder PHA-E+L exhibited significantly decreased NFIs in the CHB compared with HV and CHC subjects (p < 0.01). The MALDI-TOF/TOF-MS results of N-linked glycans from the serum glycoproteins isolated by PHA-E+L-magnetic particle conjugates showed that there was an overlap of 23 N-glycan peaks (e.g., m/z 1419.743, 1663.734, and 1743.581) between CHB, and CHC patients, 5 glycan peaks (e.g., m/z 1850.878, 1866.661, and 2037.750) were presented in virus-infected hepatitis patients compared with HV, 3 glycan peaks (1460.659, 2069.740, and 2174.772) were observed only in CHC patients. Our data provide useful information to find new biomarkers for distinguishing CHB and CHC patients based on the precision alteration of their serum glycopatterns.

Keywords: N-glycan; chronic hepatitis B; chronic hepatitis C; glycopatterns; glycoprotein; serum.


Figures

Figure 1
Figure 1
The glycopatterns of pooled sera glycoproteins from HV, CHB, and CHC patients using a lectin microarray. (A) The layout of the four area lectin microarray. Each lectin was spotted in triplicate per block, with quadruplicate blocks on one slide. Cy3-labeled BSA was spotted as a location marker and BSA as a negative control. (B) The profiles of Cy3-labeled pooled sera proteins from HVs and patients with CHB and CHC bound to the lectin microarrays. A portion of the slide with four replicates of the lectin microarrays was shown. The lectin microarrays revealed significant difference marked with orange frames. (C) Heat map and hierarchical clustering analysis of the 37 lectins for triplicate experiments. The samples were listed in columns, and the lectins were listed in rows. The color and intensity of each square indicated expression levels relative to the other data in the row. Red, high; green, low; black, medium. (D) Lectins showing significant alterations of NFIs exclusive to the CHB patients compared with HVs (E) Lectins showing significant alterations of NFIs exclusive to the CHC patients compared with HVs and lectins showing significant alterations of NFIs common in the CHB and CHC patients compared with HV according to one-way ANOVA (*p < 0.05, **p < 0.01, and ***p < 0.001).
Figure 2
Figure 2
Individual glycopattern analysis in sera from HVs, CHB, and CHC patients. Scatterplots of the data were obtained with lectin microarrays. Significant differences between HVs, CHB, and CHC patients were analyzed by a non-parametric one-way ANOVA (*p < 0.05, **p < 0.01, and ***p < 0.001).
Figure 3
Figure 3
Validation of the differential expressions of the glycopatterns in the sera from CHB, CHC patients, and HV (A) The binding pattern of glycoproteins from the three groups of sera pooled samples using 3 lectins (GSL-I, LEL, and PHA-E+L). Lane 1, HV; lane 2, CHB patients; lane 3, CHC patients. Blot affinity results showed nine apparent bands belonging to different molecular weights, ranging from 10 to 250 kDa, which were marked as b1−b9, respectively. (B) Summed fluorescence intensities (read by Image J) along the distance from lane 1 to lane 9 for each lectin binding to sera.
Figure 4
Figure 4
One MALDI-TOF-MS spectra of the PNGase F released N-linked glycan from the PHA-E+L affinity glycoproteins of the serum from HVs, CHB, and CHC patients. (A) Glycan spectra of HVs; (B) Glycan spectra of CHB patients; (C) Glycan spectra of CHC patients. Proposed structures and their m/z values are shown for each peak.
Figure 5
Figure 5
MS/MS analysis of N-glycan precursor ions in MS spectra. Precursor ions were subjected to MS/MS analysis to obtain cleavages, including glycosidic cleavages, and cross-ring cleavages. Structures of cleavage ions and m/z-values are shown in tandem mass spectra. Two major N-glycan peaks were indicated: (A) m/z 1905.634, and (B) 2288.840.

Similar articles

Cited by

References

    1. Alter M. J. (2003). Epidemiology of hepatitis B in Europe and worldwide. J. Hepatol. 39(Suppl. 1), S64–S69. 10.1016/S0168-8278(03)00141-7 - DOI - PubMed
    1. Jonas M. M. (2009). Hepatitis B and pregnancy: an underestimated issue. Liver Int. 29(Suppl. 1), 133–139. 10.1111/j.1478-3231.2008.01933.x - DOI - PubMed
    1. Arzumanyan A., Reis H. M., Feitelson M. A. (2013). Pathogenic mechanisms in HBV- and HCV-associated hepatocellular carcinoma. Nat. Rev. Cancer 13, 123–135. 10.1038/nrc3449 - DOI - PubMed
    1. Sali S., Sharafi H., Alavian S. H., Alavian S. M., Etesam F., Salimi S., et al. . (2015). Can serum level of HBsAg differentiate HBeAg-negative chronic hepatitis B from inactive carrier state? Diagn. Microbiol. Infect. Dis. 82, 114–119. 10.1016/j.diagmicrobio.2015.02.005 - DOI - PubMed
    1. He Q. Y., Lau G. K., Zhou Y., Yuen S. T., Lin M. C., Kung H. F., et al. . (2003). Serum biomarkers of hepatitis B virus infected liver inflammation: a proteomic study. Proteomics 3, 666–674. 10.1002/pmic.200300394 - DOI - PubMed