. 2017 Aug 21:8:1585.
doi: 10.3389/fmicb.2017.01585. eCollection 2017.

Succession and Fermentation Products of Grass Carp (Ctenopharyngodon idellus) Hindgut Microbiota in Response to an Extreme Dietary Shift

Affiliations

Succession and Fermentation Products of Grass Carp (Ctenopharyngodon idellus) Hindgut Microbiota in Response to an Extreme Dietary Shift

Yao Tong Hao et al. Front Microbiol. .

Abstract

Dietary intake affects the structure and function of microbes in host intestine. However, the succession of gut microbiota in response to changes in macronutrient levels during a long period of time remains insufficiently studied. Here, we determined the succession and metabolic products of intestinal microbiota in grass carp (Ctenopharyngodon idellus) undergoing an abrupt and extreme diet change, from fish meal to Sudan grass (Sorghum sudanense). Grass carp hindgut microbiota responded rapidly to the diet shift, reaching a new equilibrium approximately within 11 days. In comparison to animal-diet samples, Bacteroides, Lachnospiraceae and Erysipelotrichaceae increased significantly while Cetobacterium decreased significantly in plant-diet samples. Cetobacterium was negatively correlated with Bacteroides, Lachnospiraceae and Erysipelotrichaceae, while Bacteroides was positively correlated with Lachnospiraceae. Predicted glycoside hydrolase and polysaccharide lyase genes in Bacteroides and Lachnospiraceae from the Carbohydrate-Active enZymes (CAZy) database might be involved in degradation of the plant cell wall polysaccharides. However, none of these enzymes was detected in the grass carp genome searched against dbCAN database. Additionally, a significant decrease of short chain fatty acids levels in plant-based samples was observed. Generally, our results suggest a rapid adaption of grass carp intestinal microbiota to dietary shift, and that microbiota are likely to play an indispensable role in nutrient turnover and fermentation.

Keywords: SCFAs; freshwater fish; gut microbiota; high-fiber diet; high-protein diet.


Figures
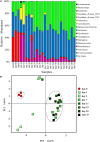
FIGURE 1
FIGURE 1
(A) Relative abundance of different bacterial phyla in the hindgut of grass carp fed on fish meal (day 0) and Sudan grass (day 1–33). Sequences that cannot be classified into any known group are listed as “No-Rank.” (B) Changes in grass carp hindgut microbiota in response to dietary shift. Principal coordinates analysis (PCoA) plot showing the microbial community differences among different time-point samples. Pairwise community distances are determined using the weighted UniFrac algorithm.
FIGURE 2
FIGURE 2
Changes in relative abundances of the main bacterial communities (shown as means of the values of three individual fishes) in the grass carp hindgut after a sudden transition from animal-based diet (fish meal, day 0) to plant-based diet (Sudan grass, day 1–33): (A) Fusobacteria and Cetobacterium; (B) Lachnospiraceae, Erysipelotrichaceae and Firmicutes; (C) Bacteroidetes and Bacteroides; (D) comparison of the changes in the five main phyla, with standard deviation values shown as error bars.
FIGURE 3
FIGURE 3
Heat map showing relative abundances of clusters of orthologous group (COG) categories predicted by PICRUSt. The relationship among specimens is determined by the complete clustering method with Bray-Curtis distance. In the heat map, the red and blue colors indicate high and low relative abundance, respectively. The P-values exhibit statistical differences in relative abundances of COG categories between animal-diet samples and day 11–33 plant-diet samples, where P < 0.05 was chosen as statistically difference. a, b, and c represent different samples on the same day.
FIGURE 4
FIGURE 4
Correlations and changes in relative abundance of microbial communities after a sudden transition from animal-based diet (fish meal, day 0) to plant-based diet (Sudan grass, day 1–33) in grass carp. (A) Molecular ecological network (MEN) of operational taxonomic units (OTUs). The module structure of network graph is based on the fast greedy modularity optimization method. Each node signifies an OTU, which can correspond to a microbial population. The colors of the nodes indicate different bacterial groups. The sizes of the nodes indicate different abundances in total sequences. A green edge indicates a negative correlation between two individual nodes, and a red edge indicates a positive correlation. (B) Heat map of specimens showing relative abundance of each bacterial group presented in MENA. The relationship among specimens is determined by the complete clustering method with Bray-Curtis distance. In the heat map, red color means higher relative abundance whereas blue color signifies lower relative abundance. The P-values exhibit statistical differences in bacterial abundances between animal-diet samples and day 11–33 plant-diet samples. P < 0.05 indicates significant difference.

Similar articles

Cited by

References

    1. Bergman E. N. (1990). Energy contributions of volatile fatty-acids from the gastrointestinal-tract in various species. Physiol. Rev. 70 567–590. - PubMed
    1. Biddle A., Stewart L., Blanchard J., Leschine S. (2013). Untangling the genetic basis of fibrolytic specialization by Lachnospiraceae and Ruminococcaceae in diverse gut communities. Diversity 5 627–640. 10.3390/d5030627 - DOI
    1. Brulc J. M., Antonopoulos D. A., Miller M. E. B., Wilson M. K., Yannarell A. C., Dinsdale E. A., et al. (2009). Gene-centric metagenomics of the fiber-adherent bovine rumen microbiome reveals forage specific glycoside hydrolases. Proc. Natl. Acad. Sci. U.S.A. 106 1948–1953. 10.1073/pnas.0806191105 - DOI - PMC - PubMed
    1. Cantarel B. L., Coutinho P. M., Rancurel C., Bernard T., Lombard V., Henrissat B. (2009). The Carbohydrate-Active EnZymes database (CAZy): an expert resource for glycogenomics. Nucleic Acids Res. 37 D233–D238. 10.1093/nar/gkn663 - DOI - PMC - PubMed
    1. Caporaso J. G., Kuczynski J., Stombaugh J., Bittinger K., Bushman F. D., Costello E. K., et al. (2010). QIIME allows analysis of high-throughput community sequencing data. Nat. Methods 7 335–336. 10.1038/nmeth.f.303 - DOI - PMC - PubMed

LinkOut - more resources