. 2017 Aug 21:8:963.
doi: 10.3389/fimmu.2017.00963. eCollection 2017.

Severe Tuberculosis in Humans Correlates Best with Neutrophil Abundance and Lymphocyte Deficiency and Does Not Correlate with Antigen-Specific CD4 T-Cell Response

Affiliations

Severe Tuberculosis in Humans Correlates Best with Neutrophil Abundance and Lymphocyte Deficiency and Does Not Correlate with Antigen-Specific CD4 T-Cell Response

Alexander V Panteleev et al. Front Immunol. .

Abstract

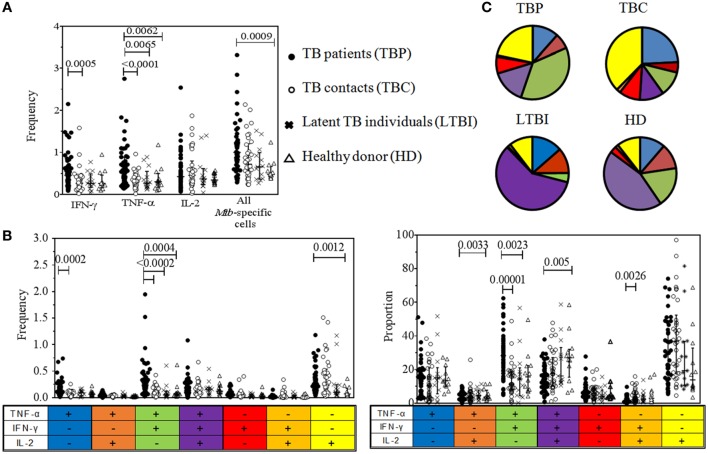
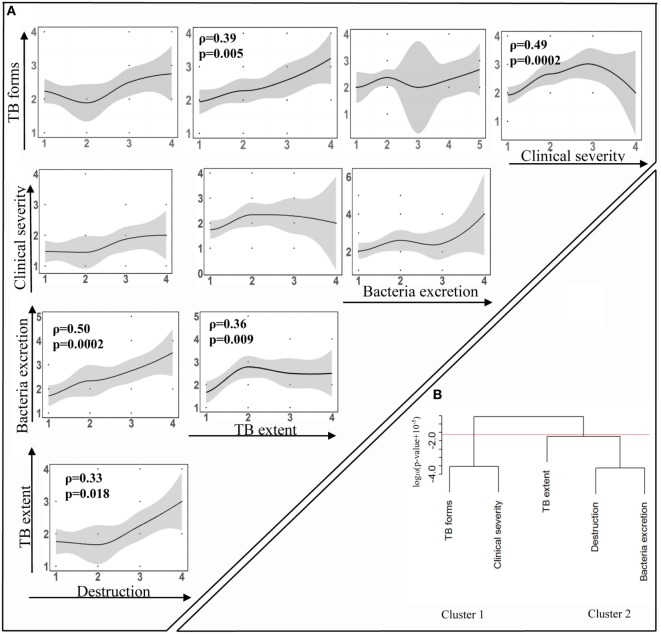
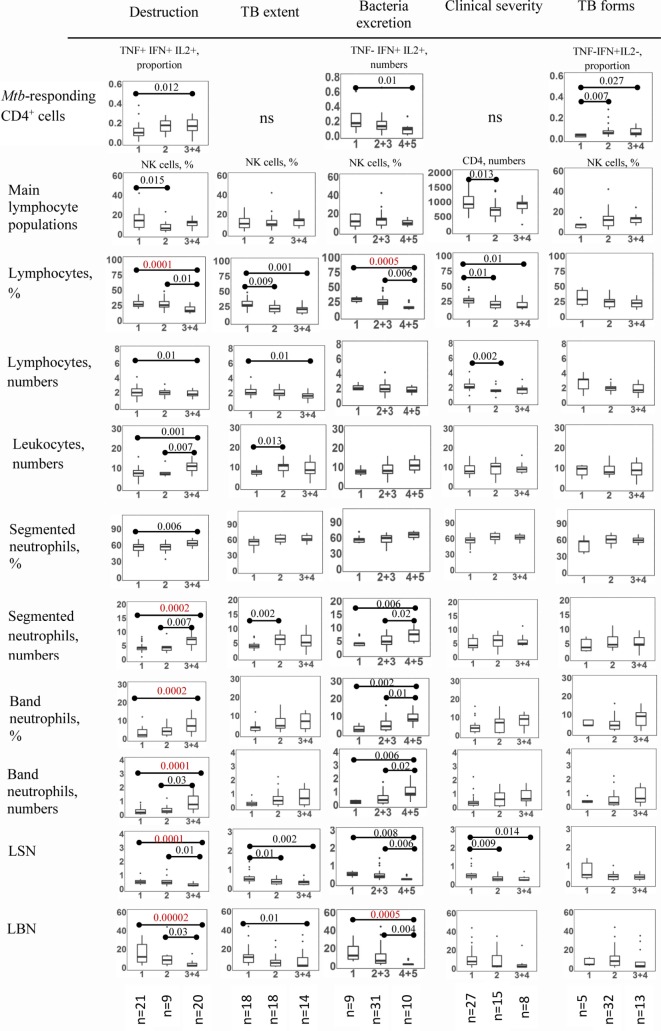
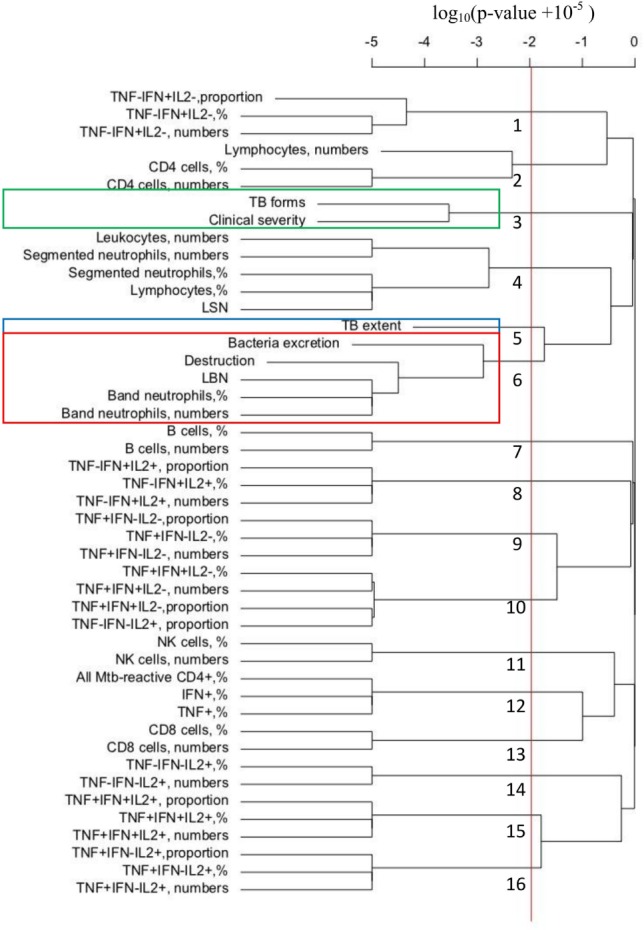
It is generally thought that Mycobacterium tuberculosis (Mtb)-specific CD4+ Th1 cells producing IFN-γ are essential for protection against tuberculosis (TB). In some studies, protection has recently been associated with polyfunctional subpopulation of Mtb-specific Th1 cells, i.e., with cells able to simultaneously secrete several type 1 cytokines. However, the role for Mtb-specific Th1 cells and their polyfunctional subpopulations during established TB disease is not fully defined. Pulmonary TB is characterized by a great variability of disease manifestations. To address the role for Mtb-specific Th1 responses during TB, we investigated how Th1 and other immune cells correlated with particular TB manifestations, such as the degree of pulmonary destruction, TB extent, the level of bacteria excretion, clinical disease severity, clinical TB forms, and "Timika X-ray score," an integrative parameter of pulmonary TB pathology. In comparison with healthy Mtb-exposed controls, TB patients (TBP) did not exhibit deficiency in Mtb-specific cytokine-producing CD4+ cells circulating in the blood and differed by a polyfunctional profile of these cells, which was biased toward the accumulation of bifunctional TNF-α+IFN-γ+IL-2- lymphocytes. Importantly, however, severity of different TB manifestations was not associated with Mtb-specific cytokine-producing cells or their polyfunctional profile. In contrast, several TB manifestations were strongly correlated with leukocyte numbers, the percent or the absolute number of lymphocytes, segmented or band neutrophils. In multiple alternative statistical analyses, band neutrophils appeared as the strongest positive correlate of pulmonary destruction, bacteria excretion, and "Timika X-ray score." In contrast, clinical TB severity was primarily and inversely correlated with the number of lymphocytes in the blood. The results suggest that: (i) different TB manifestations may be driven by distinct mechanisms; (ii) quantitative parameters and polyfunctional profile of circulating Mtb-specific CD4+ cells play a minor role in determining TB severity; and (iii) general shifts in production/removal of granulocytic and lymphocytic lineages represent an important factor of TB pathogenesis. Mechanisms leading to these shifts and their specific role during TB are yet to be determined but are likely to involve changes in human hematopoietic system.

Keywords: Th1 cells; band neutrophils; neutrophils; polyfunctional lymphocytes; pulmonary destruction; tuberculosis.


Figures

Figure 1
Figure 1
Gating strategy used to define functional subpopulations of Mycobacterium tuberculosis (Mtb)-specific CD4+ cells. Blood cells were stimulated with PPD in the presence of brefeldin A, stained for CD4 and CD8, permeabilized, and treated with mAb specific to IFN-γ, TNF-α, and IL-2. Functional subpopulations of CD4+ lymphocytes were defined by flow cytometry after gating sequentially on singlets, lymphocytes, CD4+ cells, and IFN-γ/TNF-α- and IL-2-producing cells.
Figure 2
Figure 2
Quantitative analysis of cytokine-producing CD4+ lymphocytes in tuberculosis (TB) patients and control groups. Blood cells were stimulated with PPD and CD4+ cells containing intracellular IFN-γ, TNF-α, and/or IL-2 were identified by flow cytometry. (A) Frequencies of IFN-γ+, TNF-α+, IL-2+, and all Mycobacterium tuberculosis (Mtb)-specific cells (percent after gating on CD4+ lymphocytes). (B) Frequencies of polyfunctional subpopulations of Mtb-specific CD4+ cells (percent after gating on CD4+ lymphocytes). (C) Proportions of polyfunctional subpopulations of Mtb-specific CD4+ cells, shown in pie charts and the graph (proportion out of all Mtb-specific CD4+ cells). Data were analyzed using Kruskal–Wallis test with Dunn’s post-test. False discovery rate was set at q = 0.05. The cutoff p-values were 0.0104 for data shown in (A), 0.006 for data shown in (B), and 0.0071 for data shown in (C). Note that numbers of comparisons were different for data shown in (A) and (B,C). For (A): n = 24 (four immunological parameters compared in four groups of participants, i.e., six intergroup comparisons for each of four immunological parameters); for (B,C): n = 42 (7 immunological parameters compared in four groups of participants, i.e., six intergroup comparisons for each of seven immunological parameters). Only significant differences are shown.
Figure 3
Figure 3
Relationships between diverse tuberculosis (TB) manifestations. TB patients were examined to evaluate the following five TB manifestations: the degree of pulmonary destruction (“Destruction”), TB extent, the level of bacteria excretion (“Bacteria excretion”), clinical TB severity (“Clinical severity”), and clinical TB forms (“TB forms”). Each TB manifestation was scored (Table 2), and correlations between them were analyzed using Spearman analysis with FDR adjusted method. To identify significant correlations and avoid type one error, false discovery rate was set at q = 0.05 and the significance threshold for correlations between five measured parameters was p = 0.025. (A) Correlations are visualized by showing best-fit lines and scatter plots. Indicated are correlation coefficient ρ and adjusted p-values. Figures on the axes indicate scores of corresponding TB manifestation. (B) Cluster tree. Hierarchical clustering of the data was performed using hclust routine in R (see Materials and Methods). FDR defined cutoff for significance of p = 0.025 led to the division of correlations into two major clusters.
Figure 4
Figure 4
Immunological differences between TB patients (TBP) exhibiting different severities of tuberculosis (TB) manifestations. TBP were grouped based on the severity of particular TB manifestation (scored as described in Table 2). To simplify the analysis and compensate for a relatively low number of TBP in some groups, some groups of TBP were combined as indicated in the figure (i.e., TBP having scores 2 and 3 for bacteria excretion; 4 and 5 for bacteria excretion; and 3 and 4 for other TB manifestations). Immunological differences between the groups were analyzed using Kruskal–Wallis test with Dunn’s post-test (R). False discovery rate was set at q = 0.05. The significance thresholds were determined in the following two ways: (i) separately for each comparison, the number of tests set on 3 (for three groups of comparison; for different comparisons, the p-value cutoff varied from 0.0167 to 0.033); (ii) for all types of comparisons, the number of tests set on 615 (for 41 immunological parameters, five TB severity manifestations, three groups of comparison; for all comparisons, the cutoff p-value = 0.00065). Figures indicate significant differences for N = 3. Differences that were significant after applying FDR correction for N = 615 are highlighted in red. Immunological parameters that did not differ significantly between the groups are not shown. Figures on X-axis indicate scores of the corresponding TB manifestation. Cell numbers are shown in cells/μl. Numbers of patients in each group are shown at the bottom of the figure.
Figure 5
Figure 5
Hierarchical clustering analysis of tuberculosis (TB) manifestations and immunological parameters: Mycobacterium tuberculosis (Mtb)-specific CD4+ cells do not cluster with any TB manifestation, whereas band neutrophils cluster with pulmonary destruction. For each patient included in the study, five TB manifestations were evaluated and scored as shown in Table 2 and 41 immunological parameters were determined (Table S1 in Supplementary Material). Hierarchical clustering of the data was performed using hclust routine in R (see Materials and Methods).

References

    1. WHO. Global Tuberculosis Report 2016. Geneva: World Health Organization; (2016). Available from: http://apps.who.int/iris/bitstream/10665/250441/1/9789241565394-eng.pdf
    1. Cooper AM. Cell-mediated immune responses in tuberculosis. Annu Rev Immunol (2009) 27:393–422.10.1146/annurev.immunol.021908.132703 - DOI - PMC - PubMed
    1. Flynn JL, Chan J, Lin PL. Macrophages and control of granulomatous inflammation in tuberculosis. Mucosal Immunol (2011) 4:271–8.10.1038/mi.2011.14 - DOI - PMC - PubMed
    1. Flynn JL, Chan J, Triebold KJ, Dalton DK, Stewart TA, Bloom BR. An essential role for interferon gamma in resistance to Mycobacterium tuberculosis infection. J Exp Med (1993) 178:2249–54.10.1084/jem.178.6.2249 - DOI - PMC - PubMed
    1. Cooper AM, Dalton DK, Stewart TA, Griffin JP, Russell DG, Orme IM. Disseminated tuberculosis in interferon gamma gene-disrupted mice. J Exp Med (1993) 178:2243–7.10.1084/jem.178.6.2243 - DOI - PMC - PubMed