. 2018 Jan;92(1):469-485.
doi: 10.1007/s00204-017-2048-0. Epub 2017 Sep 4.

Zoledronate dysregulates fatty acid metabolism in renal tubular epithelial cells to induce nephrotoxicity

Affiliations

Zoledronate dysregulates fatty acid metabolism in renal tubular epithelial cells to induce nephrotoxicity

Lili Cheng et al. Arch Toxicol. 2018 Jan.

Abstract

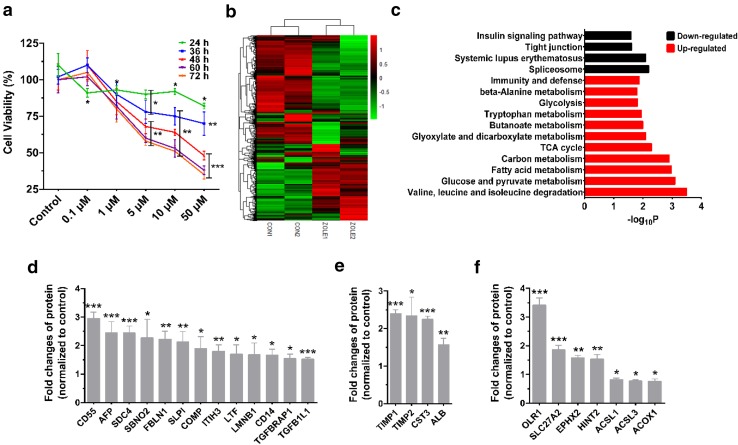
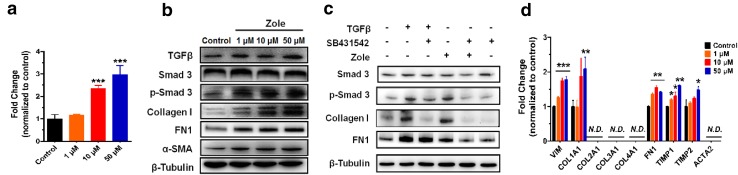
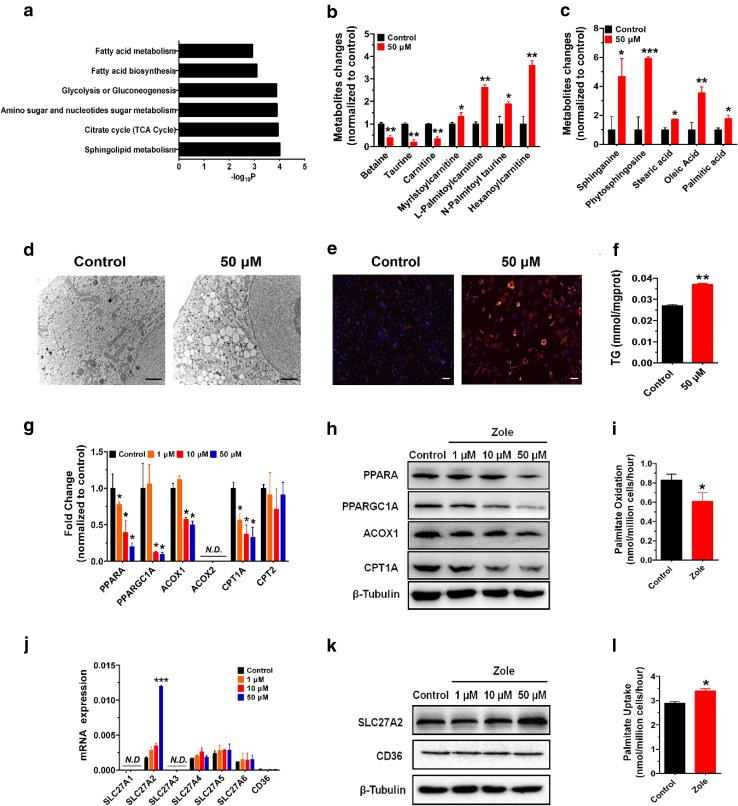
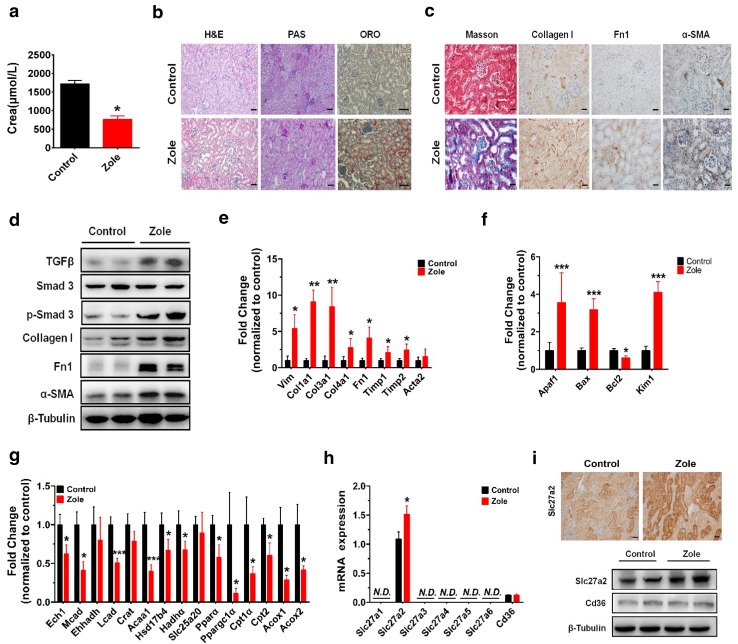
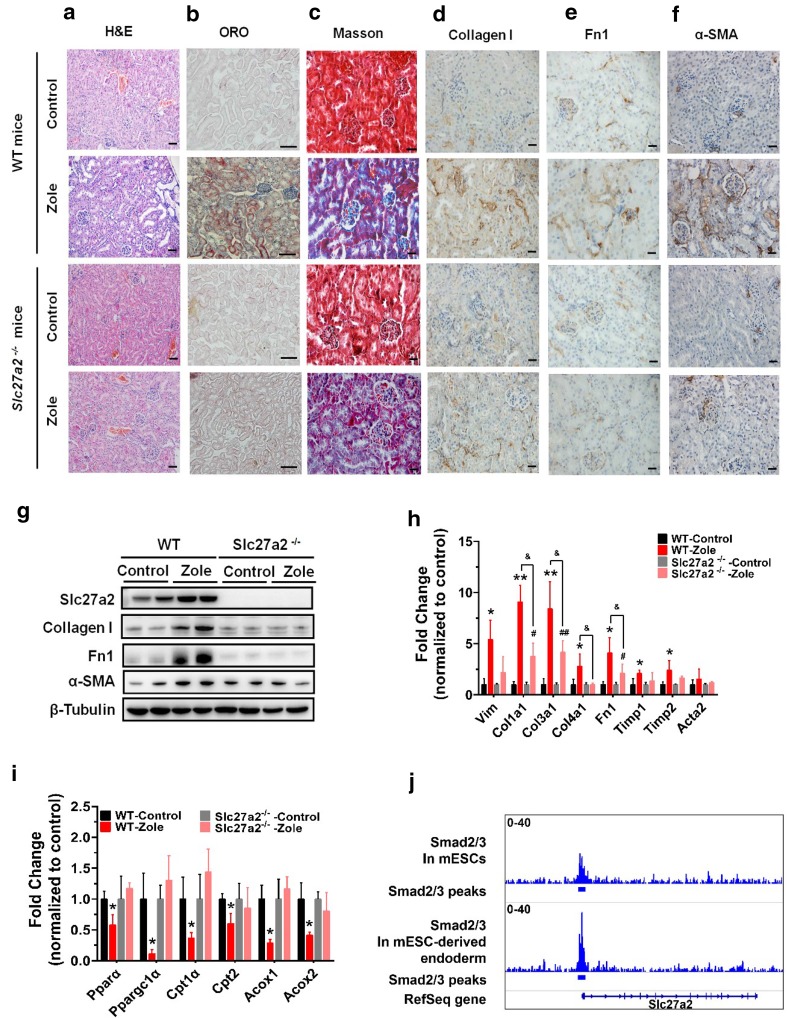
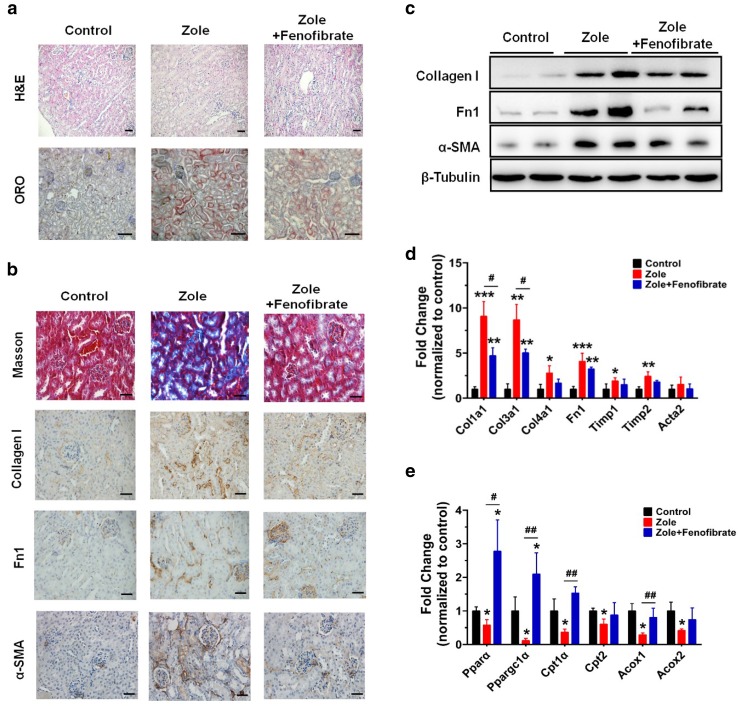
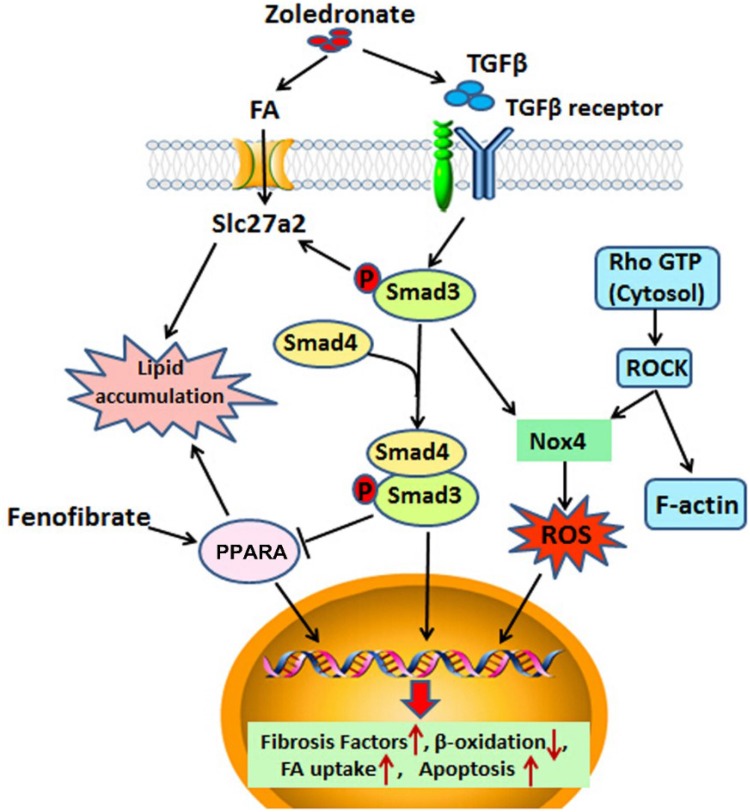
Zoledronate is a bisphosphonate that is widely used in the treatment of metabolic bone diseases. However, zoledronate induces significant nephrotoxicity associated with acute tubular necrosis and renal fibrosis when administered intravenously. There is speculation that zoledronate-induced nephrotoxicity may result from its pharmacological activity as an inhibitor of the mevalonate pathway but the molecular mechanisms are not fully understood. In this report, human proximal tubular HK-2 cells and mouse models were combined to dissect the molecular pathways underlying nephropathy caused by zoledronate treatments. Metabolomic and proteomic assays revealed that multiple cellular processes were significantly disrupted, including the TGFβ pathway, fatty acid metabolism and small GTPase signaling in zoledronate-treated HK-2 cells (50 μM) as compared with those in controls. Zoledronate treatments in cells (50 μM) and mice (3 mg/kg) increased TGFβ/Smad3 pathway activation to induce fibrosis and kidney injury, and specifically elevated lipid accumulation and expression of fibrotic proteins. Conversely, fatty acid transport protein Slc27a2 deficiency or co-administration of PPARA agonist fenofibrate (20 mg/kg) prevented zoledronate-induced lipid accumulation and kidney fibrosis in mice, indicating that over-expression of fatty acid transporter SLC27A2 and defective fatty acid β-oxidation following zoledronate treatments were significant factors contributing to its nephrotoxicity. These pharmacological and genetic studies provide an important mechanistic insight into zoledronate-associated kidney toxicity that will aid in development of therapeutic prevention and treatment options for this nephropathy.

Keywords: Fatty acid transporter; Lipid accumulation; Renal fibrosis; TGFβ1 signaling; Zoledronate.


Conflict of interest statement

Conflict of interest

The authors declare that they have no conflict of interests.

Ethical standards

The manuscript does not contain clinical studies or participant data.

Figures

Fig. 1
Fig. 1
Analysis of proteomic data of HK-2 cells treated with or without zoledronate (50 µM) for 48 h. a Cell viability curves of HK-2 cell. HK-2 cell was treated by various doses of zoledronate (0, 0.1, 1, 5, 10, 50 µM) for 24, 36, 48, 60 and 72 h. b Heat map of significantly changed proteins following zoledronate treatment on HK-2 cells. c Gene ontology (GO) analysis of HK-2 cell treated with control and zoledronate samples. The graph shows the negative log p values for the enrichment of the specific pathways. d Relative protein levels related to TGFβ and inflammation. e Relative protein levels related to fibrosis and kidney injury. f Relative protein levels related to lipid and FA metabolism. Data presented as mean ± SD (each treated sample (n = 2) were compared with each untreated one (n = 2) once, resulting in four sets of data). Zole is the abbreviation of zoledronate in all the figures
Fig. 2
Fig. 2
Effects of zoledronate treatments on TGFβ1 in HK-2 cells. a TGFβ1 mRNA expression in HK-2 cells under various concentrations of zoledronate treatments. b Western blot analysis of TGFβ1/SMAD3 signaling and fibrosis markers in the HK-2 cells after zoledronate treatments. c Comparisons of zoledronate treatment with TGFβ1 receptor agonist (TGFβ) or inhibitor (SB431542) on p-Smad3 and fibrotic factor protein expressions. d Induction of relative mRNA levels of genes related to kidney fibrosis by zoledronate treatments. All data are presented as mean ± SD (n = 6) and * P < 0.05, ** P < 0.01 and *** P < 0.001 compared to control, respectively
Fig. 3
Fig. 3
Zoledronate treatments resulting in lipid accumulation in HK-2 cells. a Pathway analysis of metabolomic data revealed FA metabolism as the major pathway affected in HK-2 cells treated with or without 50 µM zoledronate. b, c Elevations of metabolites of FAO carrier, conjugated FA intermediates, FAs and lipid species in 50 µM zoledronate-treated HK-2 cells as compared with the control group in metabolomic data. d, e Representative TEM (scale bar 2 μm) and BODIPY staining (scale bar 20 μm) showed lipid drop formation in 50 µM zoledronate-treated HK-2 cells. f TG quantifications in the samples of HK-2 cells with or without 50 µM zoledronate. g, h Relative mRNA or protein levels of genes related to FAO in the samples of HK-2 cell treated with zoledronate at doses of 0, 1, 10, 50 µM for 48 h. i Ability of FAO was reduced by zoledronate treatment using [14C]palmitate oxidation assay. j, k Relative mRNA and protein levels of genes relative to FA transport in the samples of HK-2 cell treated with zoledronate at doses of 0, 1, 10, 50 µM for 48 h. l Increased ability of FA uptake induced by zoledronate treatment using [14C]palmitate uptake assay
Fig. 4
Fig. 4
Effects of renal toxicity of zoledronate treatment in mice and its relative molecular pathways. a Reduced creatinine secretion in zoledronate-treated mice as compared with the control group. b Representative images of zoledronate untreated and treated mouse kidney sections stained with H&E, PAS and ORO staining (scale bar 1 mm). c Representative pictures of Masson’s trichrome staining (scale bar 50 μm) and collagen I, Fn1 and α-SMA IHC (scale bar 20 μm) for detection of zoledronate-induced kidney injury. d Western blot analysis of TGFβ1/Smad3 pathway and fibrosis markers in the kidney of controlled and zoledronate-treated mice. e Relative transcript levels of fibrosis and kidney-injury-related genes in controls and zoledronate-treated mice. f Relative mRNA levels of typical apoptosis and kidney injury factors. g Relative mRNA levels of FAO-related genes in controls and zoledronate-treated ones. h Relative transcript levels of FA uptake-related transporter or carrier in controls and zoledronate-treated ones. i Representative IHC images and western blot analysis of mouse kidney from control and zoledronate-treated mice for Slc27a2. (scale bar 20 μm). Each group had five mice and was treated for 4 weeks in the animal studies
Fig. 5
Fig. 5
Effects of renal toxicity of zoledronate in Slc27a2 ablated mice and its relative molecular pathways. af Representative photomicrographs of the H&E staining (scale bar 1 mm), ORO staining (scale bar 1 mm), Masson’s trichrome staining (scale bar 50 μm) and IHC images (scale bar 20 μm) of fibrosis markers of Fn1, collagen I and α-SMA from kidney sections in untreated WT and Slc27a2 / mice as well as zoledronate-treated WT and Slc27a2 / ones. g Immunoblotting of fibrosis markers of Fn1, collagen I and α-SMA in the mice above. h Relative mRNA levels of genes related to kidney fibrosis and injury from the samples above. i Relative transcript levels of FAO-related genes in untreated and zoledronate-treated WT and Slc27a2 / mice. j Tracks of Smad2/3 ChIPseq in Slc27a2 gene locus in mouse embryonic stem cells (mESCs) and mESC-derived endoderm cells. # P < 0.05, ## P < 0.01 (zoledronate-treated vs untreated Slc27a2 −/− mice); & P < 0.05 (zoledronate-treated Slc27a2 −/− mice vs treated WT ones)
Fig. 6
Fig. 6
Effect of PPARA agonist fenobrinate on zoledronate-associated nephrotoxicity. a Representative images of H&E and ORO staining of kidney sections from control mice, zoledronate-treated mice and zoledronate-treated mice with fenofibrate (Zole + fenofibrate). (scale bar 1 mm). b Masson’s trichrome staining (scale bar: 50 μm) and fibrosis markers of Fn1, collagen I and α-SMA IHC (scale bar 20 μm) from kidney sections in control, zoledronate- and zoledronate + fenofibrate-treated mice. c Western blot analysis of kidney fibrosis markers in three groups of mice above. d Relative mRNA levels of genes related to kidney fibrosis from the samples above. e Relative transcript levels of FAO-related genes in the mice above. # P < 0.05, ## P < 0.01, compared between zoledronate-treated or zoledronate + fenofibrate co-treated mice
Fig. 7
Fig. 7
Summary of model of action of zoledronate-induced renal toxicity

Similar articles

Cited by

References

    1. Anderson CM, Stahl A. SLC27 fatty acid transport proteins. Mol Asp Med. 2013;34(2–3):516–528. doi: 10.1016/j.mam.2012.07.010. - DOI - PMC - PubMed
    1. Bergner R, Siegrist B, Gretz N, Pohlmeyer-Esch G, Kranzlin B. Nephrotoxicity of ibandronate and zoledronate in Wistar rats with normal renal function and after unilateral nephrectomy. Pharmacol Res. 2015;99:16–22. doi: 10.1016/j.phrs.2015.04.016. - DOI - PubMed
    1. Bottinger EP, Bitzer M. TGF-β signaling in renal disease. J Am Soc Nephrol. 2002;13(10):2600–2610. doi: 10.1097/01.ASN.0000033611.79556.AE. - DOI - PubMed
    1. Chang JT, Green L, Beitz J. Renal failure with the use of zoledronic acid. N Engl J Med. 2003;349(17):1676–1678. doi: 10.1056/NEJM200310233491721. - DOI - PubMed
    1. Chen L, Shu Y, Liang X, et al. OCT1 is a high-capacity thiamine transporter that regulates hepatic steatosis and is a target of metformin. Proc Natl Acad Sci USA. 2014;111(27):9983–9988. doi: 10.1073/pnas.1314939111. - DOI - PMC - PubMed

MeSH terms

LinkOut - more resources