. 2017 Oct 2;127(10):3717-3729.
doi: 10.1172/JCI94130. Epub 2017 Sep 5.

mTORC1 hyperactivation arrests bone growth in lysosomal storage disorders by suppressing autophagy

Affiliations

mTORC1 hyperactivation arrests bone growth in lysosomal storage disorders by suppressing autophagy

Rosa Bartolomeo et al. J Clin Invest. .

Abstract

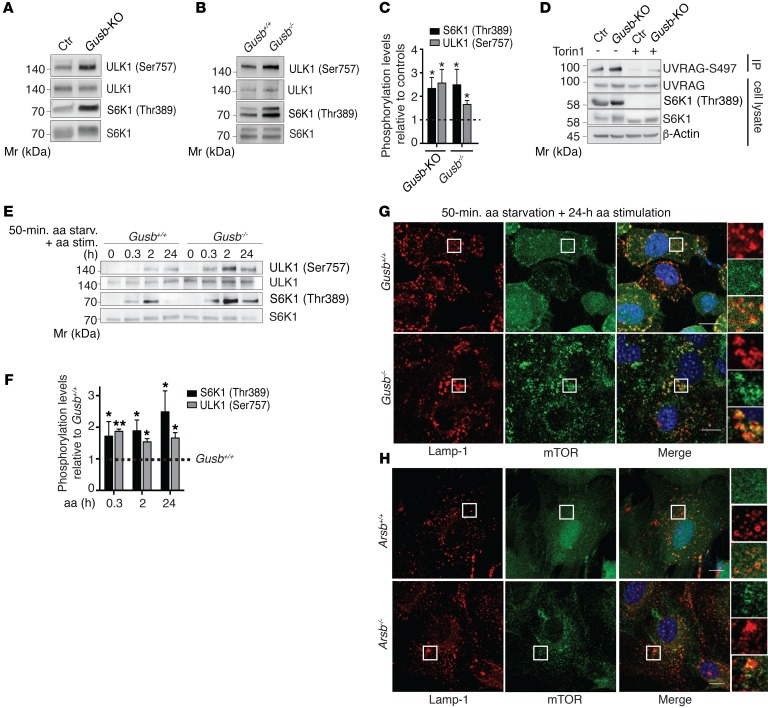
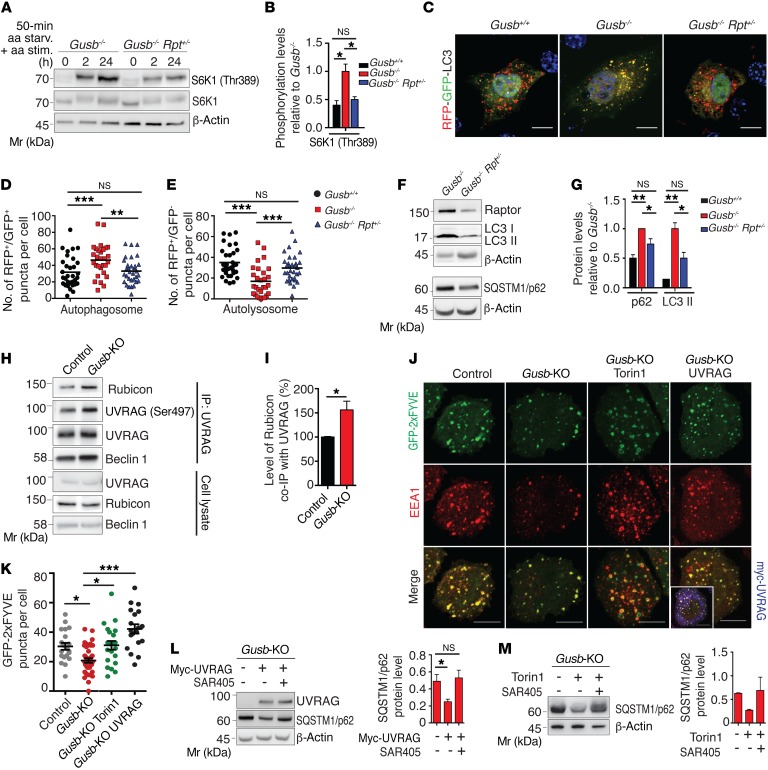
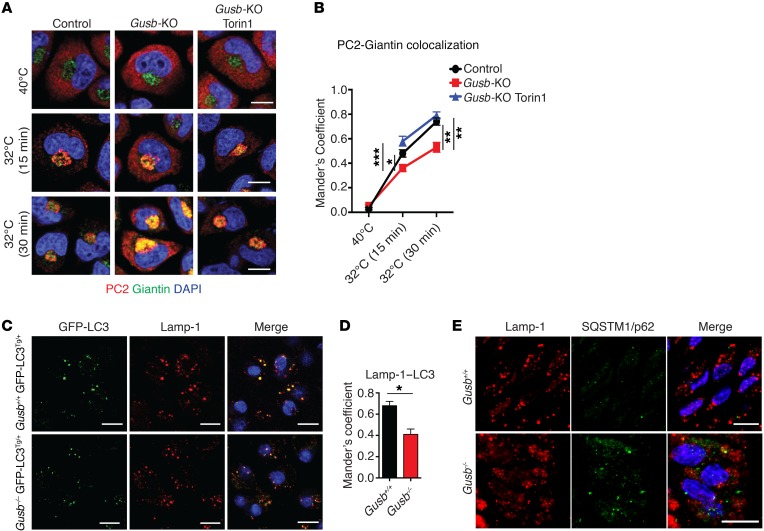
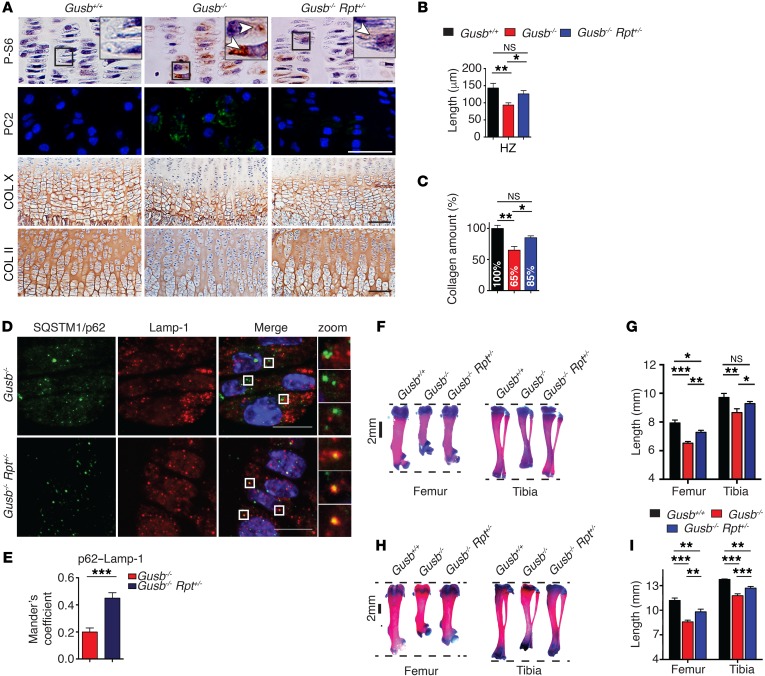
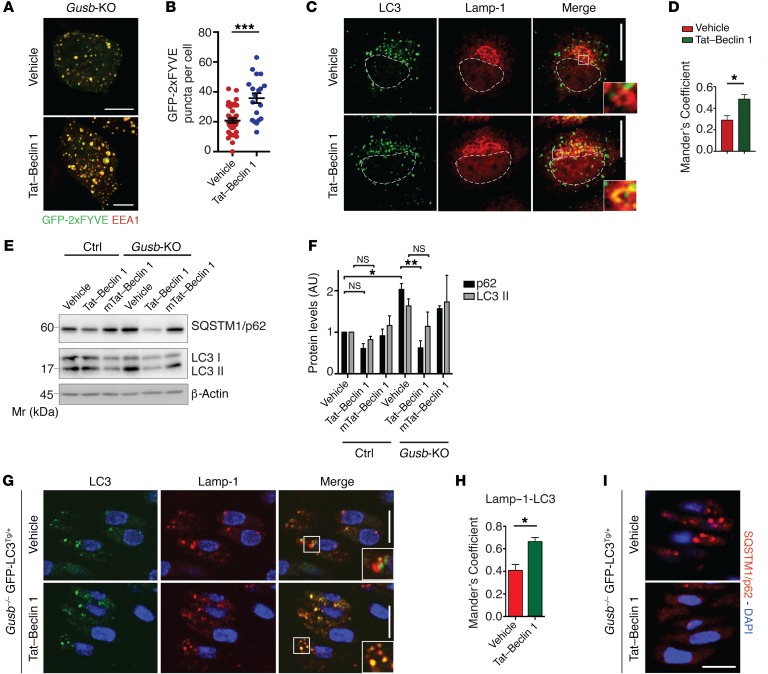
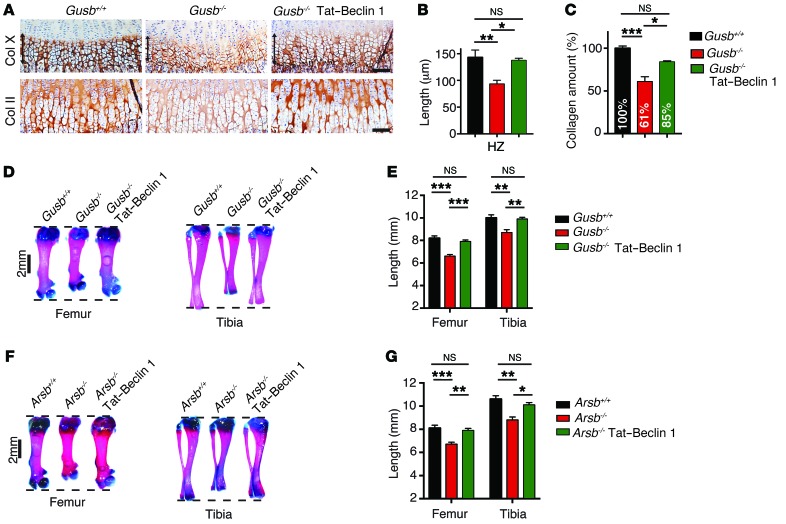
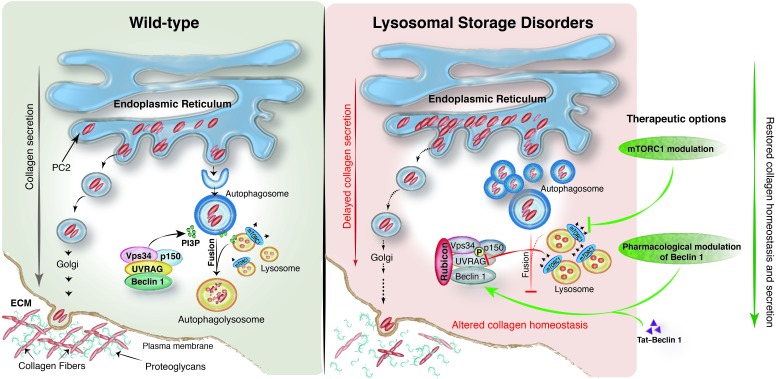
The mammalian target of rapamycin complex 1 (mTORC1) kinase promotes cell growth by activating biosynthetic pathways and suppressing catabolic pathways, particularly that of macroautophagy. A prerequisite for mTORC1 activation is its translocation to the lysosomal surface. Deregulation of mTORC1 has been associated with the pathogenesis of several diseases, but its role in skeletal disorders is largely unknown. Here, we show that enhanced mTORC1 signaling arrests bone growth in lysosomal storage disorders (LSDs). We found that lysosomal dysfunction induces a constitutive lysosomal association and consequent activation of mTORC1 in chondrocytes, the cells devoted to bone elongation. mTORC1 hyperphosphorylates the protein UV radiation resistance-associated gene (UVRAG), reducing the activity of the associated Beclin 1-Vps34 complex and thereby inhibiting phosphoinositide production. Limiting phosphoinositide production leads to a blockage of the autophagy flux in LSD chondrocytes. As a consequence, LSD chondrocytes fail to properly secrete collagens, the main components of the cartilage extracellular matrix. In mouse models of LSD, normalization of mTORC1 signaling or stimulation of the Beclin 1-Vps34-UVRAG complex rescued the autophagy flux, restored collagen levels in cartilage, and ameliorated the bone phenotype. Taken together, these data unveil a role for mTORC1 and autophagy in the pathogenesis of skeletal disorders and suggest potential therapeutic approaches for the treatment of LSDs.


Conflict of interest statement

Conflict of interest: The authors have declared that no conflict of interest exists.

Figures

Figure 1
Figure 1. Enhanced mTORC1 signaling in LSD chondrocytes.
(A) Western blot analysis of mTORC1 substrates in control (Ctr) and Gusb-KO RCS cells (A) and in primary chondrocytes from Gusb+/+ and Gusb–/– mice (B). (C) Quantification of phosphorylation levels relative to control levels (dashed line). n = 3. (D) Representative blot from a UVRAG IP assay in control and Gusb-KO RCS chondrocytes with or without Torin1 treatment (1 μM; 6 h). n = 3. (E) Western blot analysis of mTORC1 signaling on a time course of amino acid stimulation in Gusb+/+ and Gusb–/– primary chondrocytes. Cells were starved (starv.) of amino acids for 50 minutes and then stimulated (stim.) with amino acids for the indicated durations. (F) Bar graph displays phosphorylation levels of the indicated mTORC1 substrates (normalized to their total levels). Values are expressed as the fold increase compared with Gusb+/+ (represented by a dashed line). n = 3. (G and H) Gusb–/– (G) and Arsb–/– (H) primary chondrocytes were starved of amino acids for 50 minutes and then stimulated with amino acids for the indicated durations. Cells were then processed in an immunofluorescence assay to detect mTOR and Lamp-1, costained with DAPI for DNA content, and imaged. Insets show zoom ×3 and single-color channels of the boxed areas. Scale bars: 10 μm. Quantification of Lamp-1–mTOR colocalization is shown in Supplemental Figure 3. Data represent the mean values derived from the indicated number of independent experiments. Error bars indicate the SEM. *P ≤ 0.05 and **P ≤ 0.005, by unpaired Student’s t test. Mr, marker.
Figure 2
Figure 2. Hyperactivation of mTORC1 in MPS chondrocytes suppresses autophagy via a Beclin 1–Vps34–UVRAG kinase complex.
(A) Western blot analysis of mTORC1 signaling upon amino acid stimulation in Gusb–/– and Gusb–/– Rpt+/– primary chondrocytes. (B) Quantification of S6K1 phosphorylation in primary chondrocytes isolated from mice of the indicated genotypes. n = 3. (C) Representative images of an RFP-GFP-LC3 assay in primary chondrocytes from mice of the indicated genotypes. Scale bars: 10 μm. (D and E) Quantitative analysis of RFP+GFP+ puncta (D) and RFP+GFP puncta (E). Horizontal bars indicates the mean value. n = 3 chondrocytes donors/phenotype; n = 30 cells analyzed. (F) Western blot analysis of the indicated proteins in Gusb–/– and Gusb–/– Rpt+/– primary chondrocytes. β-Actin was used as a loading control. (G) Quantification of protein levels in cells from mice of the indicated genotypes. n = 3. (H) Representative blot of a UVRAG IP assay testing UVRAG interaction with Rubicon in control and Gusb-KO RCS chondrocytes. (I) Quantification of Rubicon co-IP with UVRAG. n = 3. (J) GFP-2xFYVE transfection in control and Gusb-KO RCS chondrocytes. Gusb-KO cells were treated with Torin1 (1 μM; 6 h) or cotransfected with Myc-UVRAG. Cells were costained for endosomes (EEA1). Boxed area in the bottom right-hand panel shows positive myc staining. Scale bars: 10 μm. (K) Quantitative analysis of PI3P puncta. n = 3; n = 25 cells analyzed. (L and M) Western blot analysis of SQSTM1/p62 in Gusb-KO cells transfected with Myc-UVRAG (L) or treated with Torin1 (1 μM, 6 h) and SAR405 (10 μM, 6 h) (M). β-Actin was used as a loading control. Bar graphs show quantification of protein levels. n = 3 (L) and n = 2 (M). Data represent the mean values derived from the indicated number of independent experiments. Error bars indicate the SEM. *P ≤ 0.05, **P ≤ 0.005, and ***P ≤ 0.0005, by ANOVA followed by Tukey’s post-hoc test (B, D, E, G, and K) and unpaired Student’s t test (I and L).
Figure 3
Figure 3. Altered collagen trafficking and autophagy dysfunction in growth plates of MPSVII mice.
(A) PC2 secretion was synchronized for 3 hours at 40°C and then shifted to 32°C (ER block release) for the indicated durations (min). Representative images of PC2 localization (red) in ER and Golgi area (Giantin, green) in control chondrocytes and vehicle- or Torin1-treated (6 h, 1 μM) Gusb-KO chondrocytes, 15 and 30 minutes after the ER block release of PC2. Scale bars: 10 μm. (B) Quantification of PC2-Giantin colocalization over time. n = 3; n = 50 cells for each time point. (C) Representative images of GFP-LC3 puncta (autophagosomes) and Lamp-1 (lysosomes) immunostaining in femoral growth plates from Gusb+/+ GFP-LC3Tg/+ and Gusb–/– GFP-LC3Tg/+ mice at P6. Scale bars: 10 μm. (D) Quantification of Lamp-1–LC3 colocalization. n = 3 mice per group. (E) Representative images of SQSTM1/p62 and Lamp-1 immunofluorescence in femoral growth plates from mice of the indicated genotypes. Scale bars: 10 μm. n = 3 mice per group. Data represent the mean values derived from the indicated number of independent experiments. Error bars indicate the SEM. *P ≤ 0.05, **P ≤ 0.005, and ***P ≤ 0.0005, by ANOVA followed by Tukey’s post-hoc test (B) and unpaired Student’s t test (D).
Figure 4
Figure 4. Normalization of mTORC1 signaling restores collagen trafficking and rescues bone phenotype in MPS VII mice.
(A) Representative images of femoral growth plate sections isolated from Gusb+/+, Gusb–/–, and Gusb–/– Rpt+/– mice at P15. P-S6 immunostaining (arrows, brown, top row), intracellular PC2 (green, second row), COL X (third row), and COL II (brown, bottom row). Nuclei were counterstained with hematoxylin (pink, top row and bottom row) or DAPI (blue, second row). Scale bars: 100 μm. Insets show magnification ×3. (B) Bar graphs show the length of the HZ (COL X+ area). n = 5 mice per genotype. (C) Quantification of collagen isolated from femoral and tibia cartilages from mice of the indicated genotypes and expressed as the percentage of Gusb+/+ mice. n ≥ 5 mice per genotype. (D) Representative images of SQSTM1/p62 and Lamp-1 immunofluorescence in femoral growth plates isolated from Gusb–/– and Gusb–/– Rpt+/– mice at P15. n = 3 mice per group. Scale bars: 10 μm; zoom, ×5. (E) Quantification of P62–Lamp-1 colocalization. (F) Representative images of Alcian blue and alizarin red staining of femurs and tibiae from P15 Gusb+/+, Gusb–/–, and Gusb–/– Rpt+/– mice. (G) Femur and tibia lengths for mice of the indicated genotypes. n = 6 mice per genotype. (H) Representative images of Alcian blue and alizarin red staining of femurs and tibiae from P30 Gusb+/+, Gusb–/–, and Gusb–/– Rpt+/– mice. (I) Femur and tibia lengths for mice of the indicated genotypes. n = 6 mice per genotype. Data represent the mean values derived from the indicated number of mice. Error bars indicate the SEM. *P ≤ 0.05, **P ≤ 0.005, and ***P ≤ 0.0005, by ANOVA followed by Tukey’s post-hoc test (B, C, G, and I) and unpaired Student’s t test (E).
Figure 5
Figure 5. Autophagy induction with Tat–Beclin 1 rescues the AV-lysosome fusion defect in MPS chondrocytes.
(A) Gusb-KO cells were transfected with GFP-2xFYVE and treated or not with Tat–Beclin 1 (10 μM, 2 h). Cells were costained for endosomes (EEA1). Scale bars: 10 μm. (B) Quantitative analysis of PI3P puncta. n = 3 independent transfections; n = 20 cells analyzed. (C) Immunofluorescence of Lamp-1 and LC3 in Gusb-KO cells treated with Tat–Beclin 1 peptide (10 μM; 2 h). Insets show colocalization in selected areas at higher magnification (zoom ×3.5). Scale bars: 10 μm. (D) Quantification of Lamp-1–LC3 colocalization. n = 3 independent treatments; n = 30 cells analyzed. (E) Western blot analysis of the indicated proteins in control and Gusb-KO cells treated with vehicle, Tat–Beclin 1 (20 μM; 2 h), or with an inactive form of Tat–Beclin 1 (mTat-Beclin 1) (20 μM; 2 h). β-Actin was used as a loading control. (F) Quantification of protein levels. n = 3. (G and I) Representative images of GFP–LC3 puncta (AVs), Lamp-1 (G), and SQSTM1/p62 (I) immunostaining in femoral growth plates from Gusb–/– GFP-LC3Tg/+ mice at P6. Tat–Beclin 1 peptide was administered as indicated (2 mg/kg, daily for 6 d). Scale bar: 10 μm (zoom ×2). (H) Quantification of Lamp-1–LC3 colocalization. n = 3 mice per group. Data represent the mean values derived from the indicated number of mice per independent experiment. Error bars indicate the SEM. *P ≤ 0.05, **P ≤ 0.005, and ***P ≤ 0.0005, by paired Student’s t test (B, D, and H) and ANOVA followed by Tukey’s post-hoc test (F).
Figure 6
Figure 6. Autophagy induction with Tat–Beclin 1 improves bone phenotype in MPS mice.
(A) Representative images of femoral growth plate sections from Gusb+/+, Gusb–/–, and Gusb–/– Tat–Beclin 1–treated mice (2 mg/kg daily for 15 d) immunostained with COL X and COL II. n = 3 mice per group. Scale bars: 100 μm. (B) Length of HZ. n = 3 mice per group. (C) Quantitative measurement of collagen isolated from the growth plates of mice treated as in A. n = 8. (D) Representative images of femurs and tibiae from P15 mice treated as in A. (E) Femur and tibia lengths. n = 8 mice per group. (F) Representative images of femurs and tibiae from Arsb+/+, Arsb–/–, and Arsb–/– Tat–Beclin 1–treated mice (2 mg/kg daily for 15 days). (G) Femur and tibia lengths. n = 6 mice per group. Data represent the mean values derived from the indicated number of mice. Error bars indicate the SEM. *P ≤ 0.05, **P ≤ 0.005, and ***P ≤ 0.0005, by ANOVA followed by Tukey’s post-hoc test.
Figure 7
Figure 7. Proposed pathogenetic mechanism in LSD chondrocytes.
Left: In WT chondrocytes, collagen homeostasis is reached through equilibrium between the pool that needs to be secreted and the pool that needs to be degraded. Within this context, fine-tuned mTORC1 activity is particularly important for autophagy regulation, autophagosome biogenesis, AV-lysosome fusion, and, in turn, PC2 homeostasis. A key protein complex required for AV-lysosome fusion is represented by Beclin 1–Vps34–UVRAG, a class III–PI3K complex that produces a pool of PI3P required for vesicle fusion. Right: Lysosomal impairment in LSD is responsible for abnormal mTORC1 signaling. Among the autophagy targets of mTORC1, UVRAG activity is particular sensitive to mTORC1 phosphorylation. Thus, in LSD, a stable complex between UVRAG and Rubicon is seen, and insufficient PI3P is produced. This primarily affects AV-lysosome fusion, leading to AV accumulation and a subsequent delay in procollagen trafficking. To overcome the blockage of AV-lysosome fusion and restore proper collagen homeostasis in LSD, therapeutic options can be directed toward either mTORC1 modulation (repression) or pharmacological modulation of the Beclin 1–Vps34 complex (induction).

References

    1. Karsenty G, Kronenberg HM, Settembre C. Genetic control of bone formation. Annu Rev Cell Dev Biol. 2009;25:629–648. doi: 10.1146/annurev.cellbio.042308.113308. - DOI - PubMed
    1. Bateman JF, Boot-Handford RP, Lamandé SR. Genetic diseases of connective tissues: cellular and extracellular effects of ECM mutations. Nat Rev Genet. 2009;10(3):173–183. doi: 10.1038/nrg2520. - DOI - PubMed
    1. Luzio JP, Pryor PR, Bright NA. Lysosomes: fusion and function. Nat Rev Mol Cell Biol. 2007;8(8):622–632. doi: 10.1038/nrm2217. - DOI - PubMed
    1. Futerman AH, van Meer G. The cell biology of lysosomal storage disorders. Nat Rev Mol Cell Biol. 2004;5(7):554–565. doi: 10.1038/nrm1423. - DOI - PubMed
    1. Clarke LA, Hollak CE. The clinical spectrum and pathophysiology of skeletal complications in lysosomal storage disorders. Best Pract Res Clin Endocrinol Metab. 2015;29(2):219–235. doi: 10.1016/j.beem.2014.08.010. - DOI - PubMed

MeSH terms