

Advancing The Cancer Genome Atlas glioma MRI collections with expert segmentation labels and radiomic features
- PMID: 28872634
- PMCID: PMC5685212
- DOI: 10.1038/sdata.2017.117
Advancing The Cancer Genome Atlas glioma MRI collections with expert segmentation labels and radiomic features
Abstract
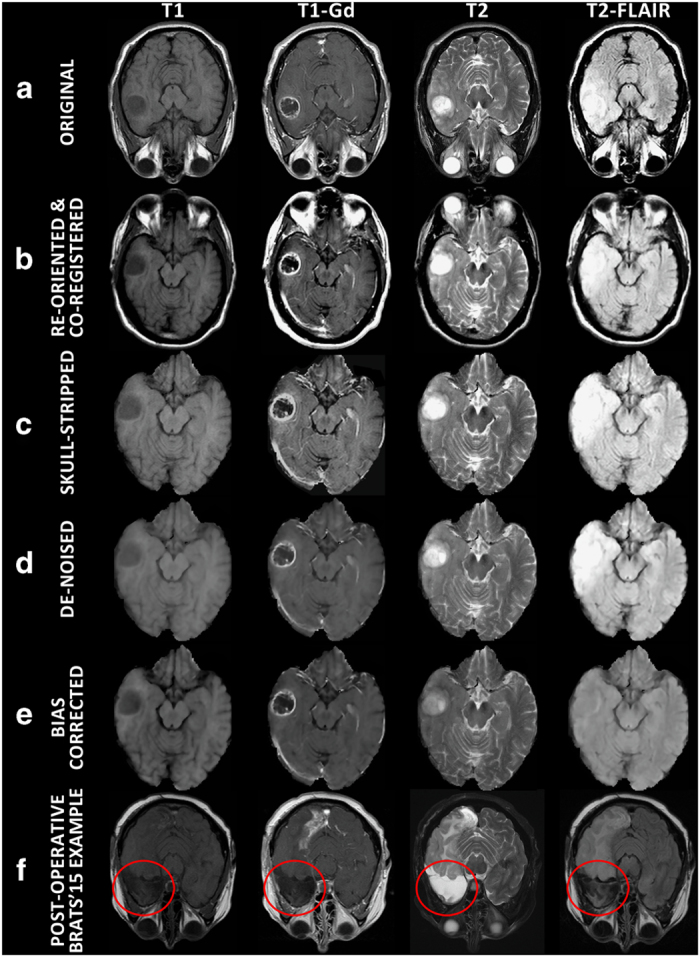
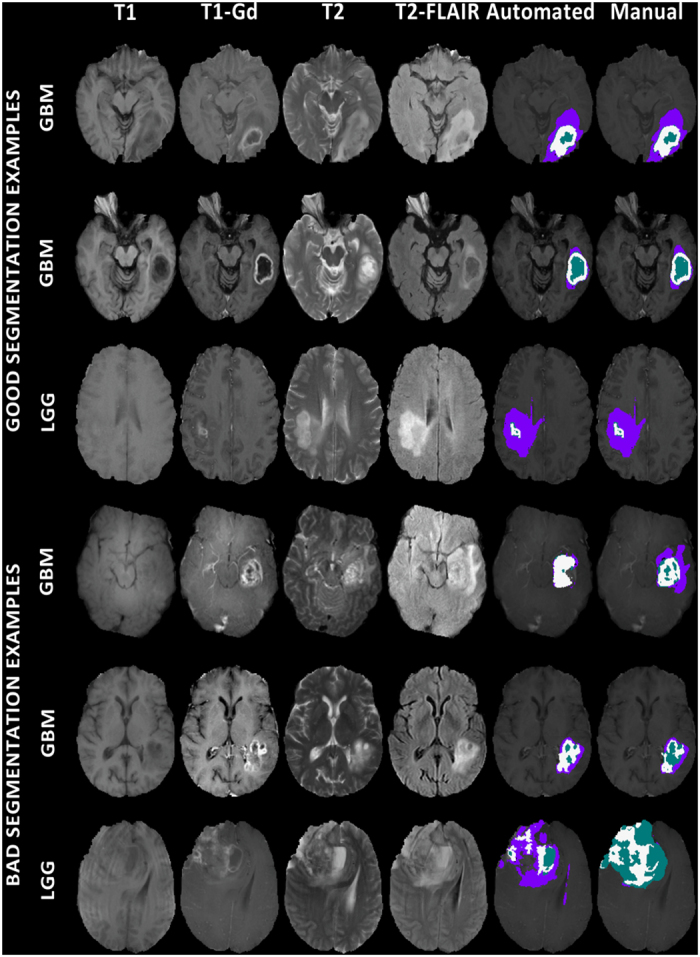
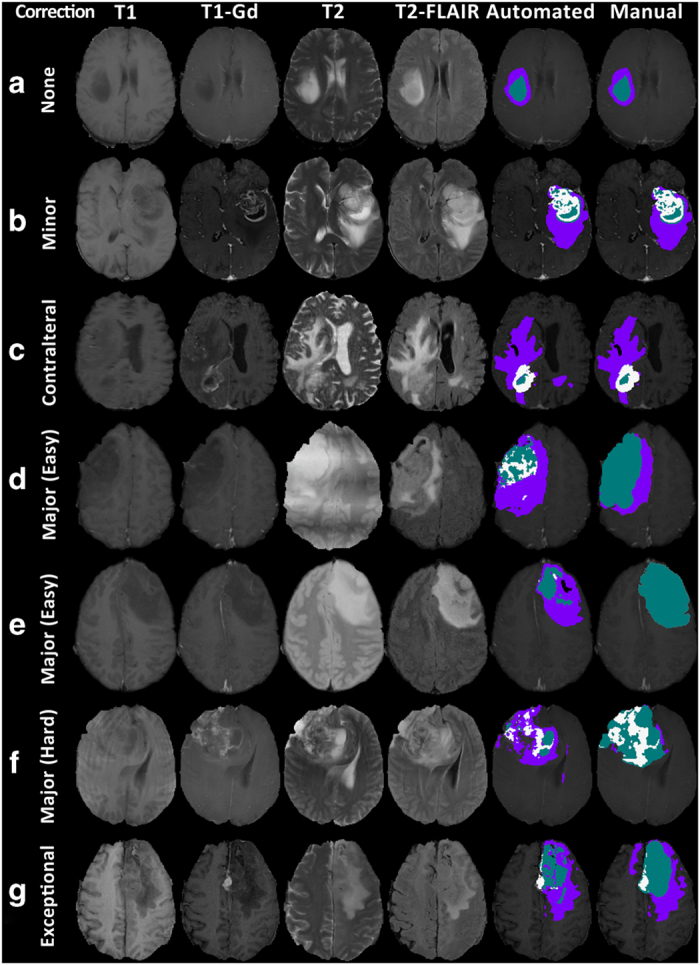
Gliomas belong to a group of central nervous system tumors, and consist of various sub-regions. Gold standard labeling of these sub-regions in radiographic imaging is essential for both clinical and computational studies, including radiomic and radiogenomic analyses. Towards this end, we release segmentation labels and radiomic features for all pre-operative multimodal magnetic resonance imaging (MRI) (n=243) of the multi-institutional glioma collections of The Cancer Genome Atlas (TCGA), publicly available in The Cancer Imaging Archive (TCIA). Pre-operative scans were identified in both glioblastoma (TCGA-GBM, n=135) and low-grade-glioma (TCGA-LGG, n=108) collections via radiological assessment. The glioma sub-region labels were produced by an automated state-of-the-art method and manually revised by an expert board-certified neuroradiologist. An extensive panel of radiomic features was extracted based on the manually-revised labels. This set of labels and features should enable i) direct utilization of the TCGA/TCIA glioma collections towards repeatable, reproducible and comparative quantitative studies leading to new predictive, prognostic, and diagnostic assessments, as well as ii) performance evaluation of computer-aided segmentation methods, and comparison to our state-of-the-art method.
Conflict of interest statement
The authors declare no competing financial interests.
Figures
Dataset use reported in
References
Data Citations
-
- Scarpace L. 2016. The Cancer Imaging Archive. http://doi.org/10.7937/K9/TCIA.2016.RNYFUYE9 - DOI
-
- Pedano N. 2016. The Cancer Imaging Archive. http://doi.org/10.7937/K9/TCIA.2016.L4LTD3TK - DOI
-
- Bakas S. 2017. The Cancer Imaging Archive. https://doi.org/10.7937/K9/TCIA.2017.KLXWJJ1Q - DOI
-
- Bakas S. 2017. The Cancer Imaging Archive. https://doi.org/10.7937/K9/TCIA.2017.GJQ7R0EF - DOI
References
-
- Rutman A. M. & Kuo M. D. Radiogenomics: Creating a link between molecular diagnostics and diagnostic imaging. European Journal of Radiology 70, 232–241 (2009). - PubMed
Publication types
MeSH terms
Substances
Grants and funding
LinkOut - more resources
Full Text Sources
Other Literature Sources
Medical
