

Climatologies at high resolution for the earth's land surface areas
- PMID: 28872642
- PMCID: PMC5584396
- DOI: 10.1038/sdata.2017.122
Climatologies at high resolution for the earth's land surface areas
Abstract
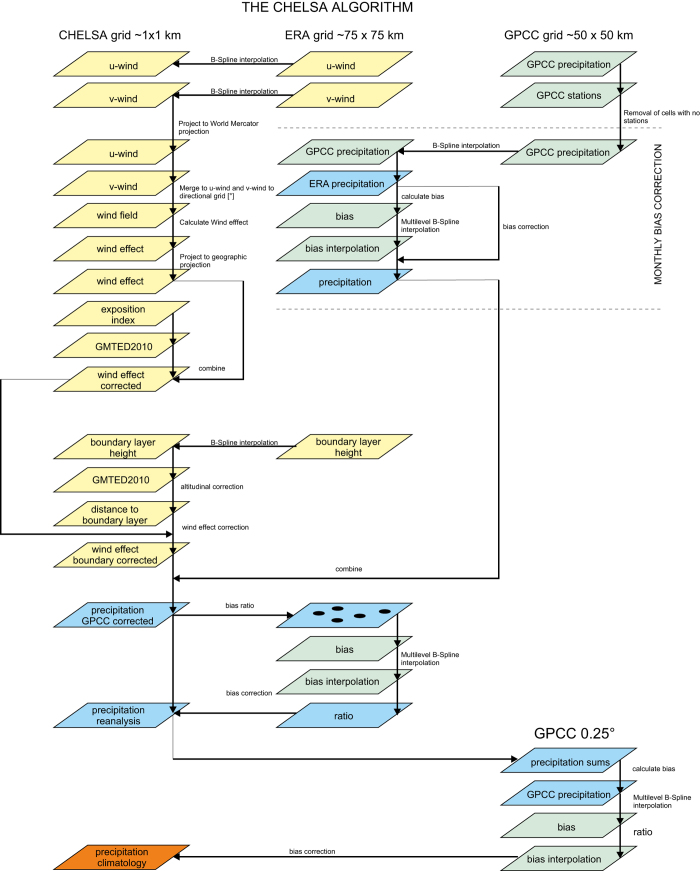
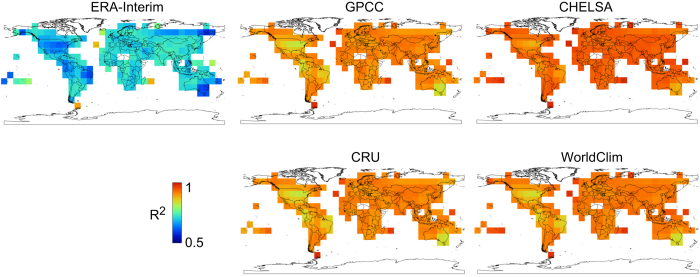
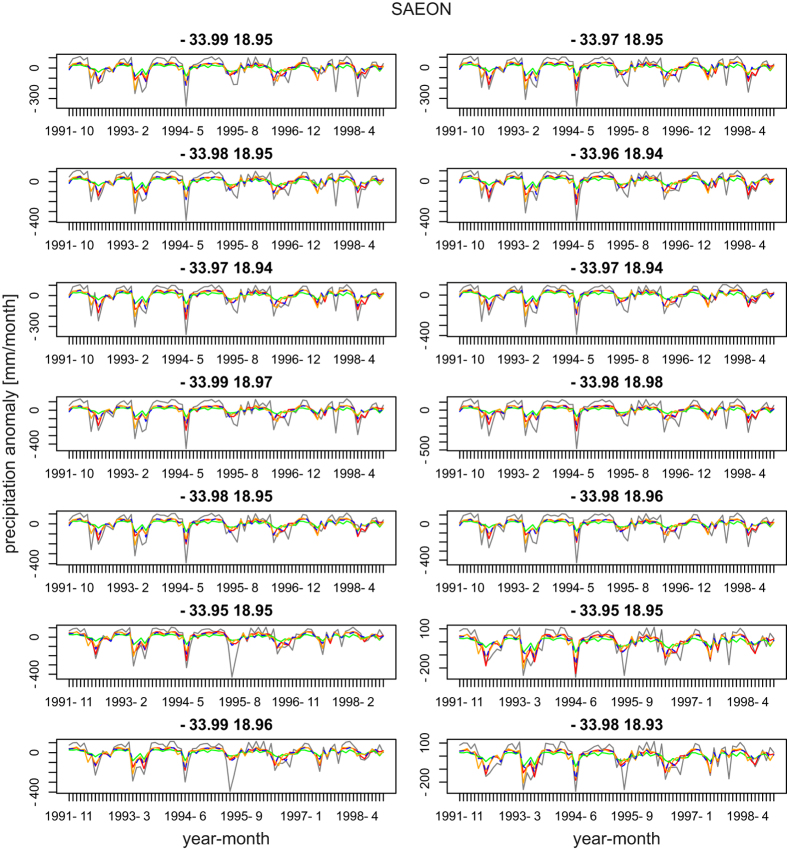
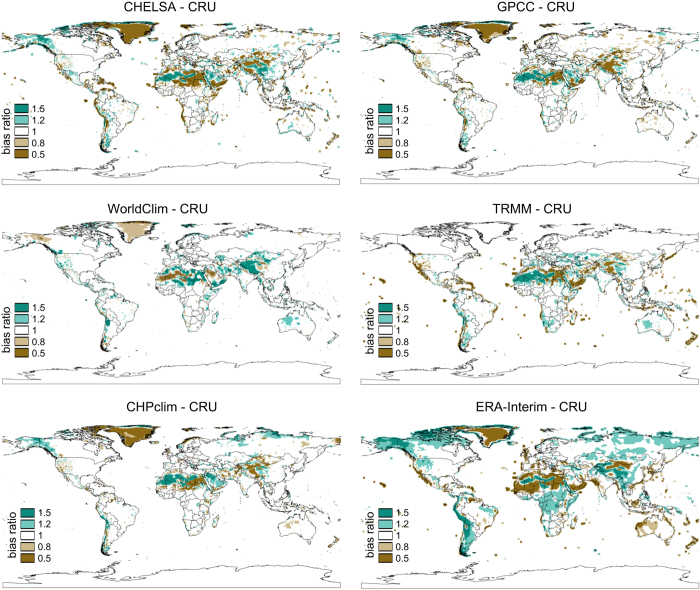
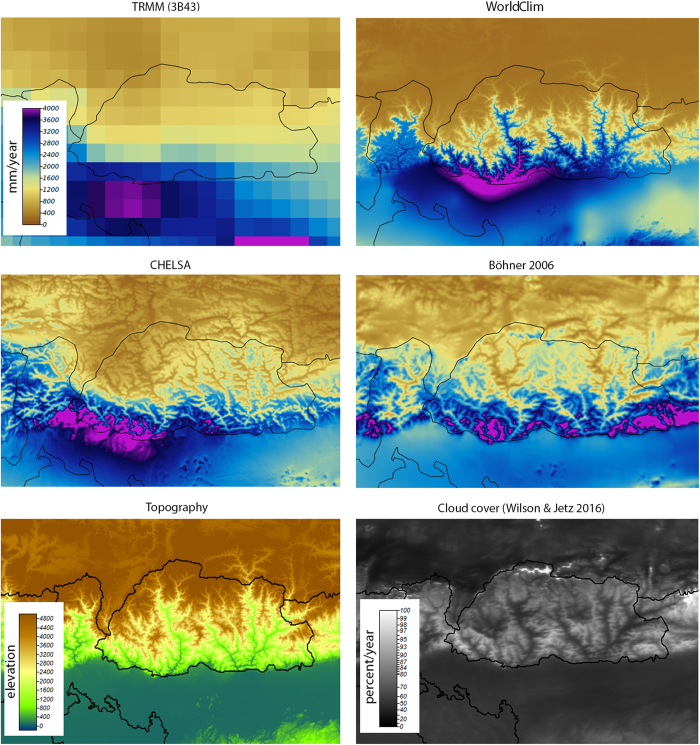
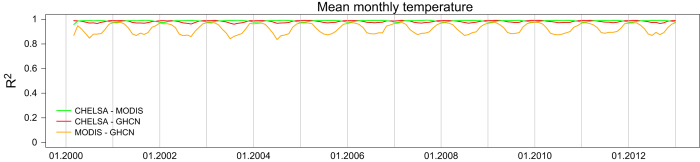
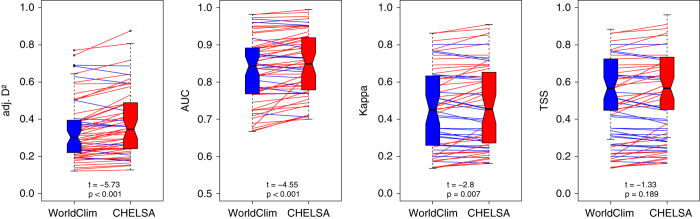
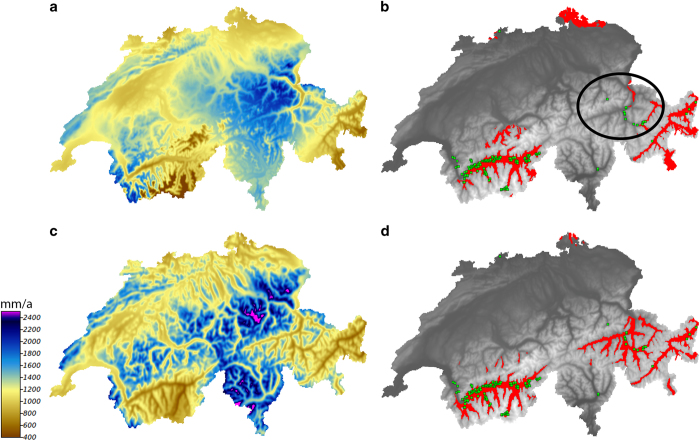
High-resolution information on climatic conditions is essential to many applications in environmental and ecological sciences. Here we present the CHELSA (Climatologies at high resolution for the earth's land surface areas) data of downscaled model output temperature and precipitation estimates of the ERA-Interim climatic reanalysis to a high resolution of 30 arc sec. The temperature algorithm is based on statistical downscaling of atmospheric temperatures. The precipitation algorithm incorporates orographic predictors including wind fields, valley exposition, and boundary layer height, with a subsequent bias correction. The resulting data consist of a monthly temperature and precipitation climatology for the years 1979-2013. We compare the data derived from the CHELSA algorithm with other standard gridded products and station data from the Global Historical Climate Network. We compare the performance of the new climatologies in species distribution modelling and show that we can increase the accuracy of species range predictions. We further show that CHELSA climatological data has a similar accuracy as other products for temperature, but that its predictions of precipitation patterns are better.
Conflict of interest statement
The authors declare no competing financial interests.
Figures
Similar articles
-
Global daily 1 km land surface precipitation based on cloud cover-informed downscaling.Sci Data. 2021 Nov 26;8(1):307. doi: 10.1038/s41597-021-01084-6. Sci Data. 2021. PMID: 34836980 Free PMC article.
-
High-resolution monthly precipitation and temperature time series from 2006 to 2100.Sci Data. 2020 Jul 23;7(1):248. doi: 10.1038/s41597-020-00587-y. Sci Data. 2020. PMID: 32703947 Free PMC article.
-
Selecting the optimal gridded climate dataset for Nigeria using advanced time series similarity algorithms.Environ Sci Pollut Res Int. 2024 Feb;31(10):15986-16010. doi: 10.1007/s11356-024-32128-0. Epub 2024 Feb 3. Environ Sci Pollut Res Int. 2024. PMID: 38308777
-
Designing ecological climate change impact assessments to reflect key climatic drivers.Glob Chang Biol. 2017 Jul;23(7):2537-2553. doi: 10.1111/gcb.13653. Epub 2017 Mar 6. Glob Chang Biol. 2017. PMID: 28173628 Review.
-
A review of alternative climate products for SWAT modelling: Sources, assessment and future directions.Sci Total Environ. 2021 Nov 15;795:148915. doi: 10.1016/j.scitotenv.2021.148915. Epub 2021 Jul 8. Sci Total Environ. 2021. PMID: 34328938 Review.
Cited by
-
Unraveling the genomic landscape of Campylorhynchus wrens along western Ecuador's precipitation gradient: Insights into hybridization, isolation by distance, and isolation by the environment.Ecol Evol. 2024 Jul 11;14(7):e11661. doi: 10.1002/ece3.11661. eCollection 2024 Jul. Ecol Evol. 2024. PMID: 38994212 Free PMC article.
-
Approximate Bayesian computation and ecological niche models elucidate the demographic history and current fragmented population distribution of a Korean endemic shrub.Ecol Evol. 2023 Dec 6;13(12):e10792. doi: 10.1002/ece3.10792. eCollection 2023 Dec. Ecol Evol. 2023. PMID: 38077507 Free PMC article.
-
Analysis of the Potential Range of Mountain Pine-Broadleaf Ecotone Forests and Its Changes under Moderate and Strong Climate Change in the 21st Century.Plants (Basel). 2023 Oct 26;12(21):3698. doi: 10.3390/plants12213698. Plants (Basel). 2023. PMID: 37960054 Free PMC article.
-
Rear-edge, low-diversity, and haplotypic uniformity in cold-adapted Bupleurum euphorbioides interglacial refugia populations.Ecol Evol. 2020 Aug 24;10(19):10449-10462. doi: 10.1002/ece3.6700. eCollection 2020 Oct. Ecol Evol. 2020. PMID: 33072272 Free PMC article.
-
Shifts in mosquito diversity and abundance along a gradient from oil palm plantations to conterminous forests in Borneo.Ecosphere. 2021 Apr;12(4):e03463. doi: 10.1002/ecs2.3463. Epub 2021 Apr 23. Ecosphere. 2021. PMID: 33996190 Free PMC article.
References
Data Citations
-
- Karger D. N. 2017. Dryad Digital Repository. http://dx.doi.org/10.5061/dryad.kd1d4 - DOI
References
-
- Biasutti M., Yuter S. E., Burleyson C. D. & Sobel A. H. Very high resolution rainfall patterns measured by TRMM precipitation radar: seasonal and diurnal cycles. Clim. Dyn 39, 239–258 (2011).
-
- Huffman G. J. et al. The TRMM Multisatellite Precipitation Analysis (TMPA): Quasi-Global, Multiyear, Combined-Sensor Precipitation Estimates at Fine Scales. J. Hydrometeorol. 8, 38–55 (2007).
-
- Maraun D. et al. Precipitation downscaling under climate change: Recent developments to bridge the gap between dynamical models and the end user. Rev. Geophys. 48, RG3003 (2010).
-
- Wood A. W., Leung L. R., Sridhar V. & Lettenmaier D. P. Hydrologic Implications of Dynamical and Statistical Approaches to Downscaling Climate Model Outputs. Clim. Change 62, 189–216 (2004).
Publication types
LinkOut - more resources
Full Text Sources
Other Literature Sources
