. 2017 Sep 5:6:e27725.
doi: 10.7554/eLife.27725.

The readability of scientific texts is decreasing over time

Affiliations

The readability of scientific texts is decreasing over time

Pontus Plavén-Sigray et al. Elife. .

Abstract

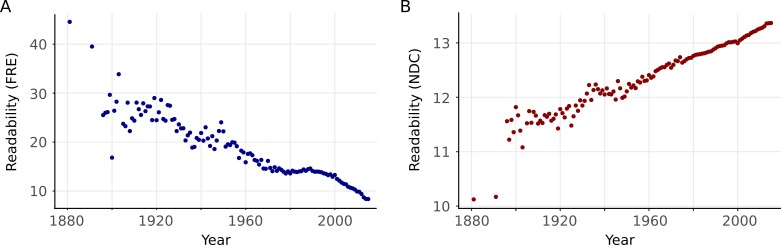
Clarity and accuracy of reporting are fundamental to the scientific process. Readability formulas can estimate how difficult a text is to read. Here, in a corpus consisting of 709,577 abstracts published between 1881 and 2015 from 123 scientific journals, we show that the readability of science is steadily decreasing. Our analyses show that this trend is indicative of a growing use of general scientific jargon. These results are concerning for scientists and for the wider public, as they impact both the reproducibility and accessibility of research findings.

Keywords: data analysis; jargon; metascience; readability; scientific communication.


Conflict of interest statement

No competing interests declared.

Figures

Figure 1.
Figure 1.. Data and readability analysis pipeline.
(A) Schematic depicting the major steps in the abstract extraction and analysis pipeline. Readability formulas are provided in full in Materials and methods. (B) Number of articles in the corpus published in each year. The color scale is logarithmic. (C) Starting year of each journal within the corpus. This corresponds to the first article in PubMed with an abstract. The color scale is linear. Source data for this figure is available in Figure 2—source data 1.
Figure 2.
Figure 2.. Scientific abstracts have become harder to read over time.
(A) Mean Flesch Reading Ease (FRE) readability for each year. Lower scores indicate less readability. (B) Mean New Dale-Chall (NDC) readability for each year. Higher scores indicate less readability. (C,D) Kernel density estimates displaying the readability (C: FRE, D: NDC) distribution of all abstracts for each year. Color scales are linear and represent relative density of scores within each year. (E) Relationship between FRE and NDC scores across all abstracts, depicted by a two-dimensional kernel density estimate. Axis limits are set to include at least 99% of the data. The color scale is exponential and represents the number of articles at each pixel. (F-H) Kernel density estimates displaying the components of the readability measures (F: syllable to word ratio; G: percentage of difficult words; H: word to sentence ratio) distribution of all abstracts for each year. Color scales are linear and represent relative density of values within each year. For kernel density plots over time (C,D,F,G,H), years with fewer than 10 abstracts are excluded to obtain accurate density estimates.
Figure 2—figure supplement 1.
Figure 2—figure supplement 1.. Readability over years with minimal preprocessing to illustrate that the preprocessing steps have not induced the trend.
(A) Mean Flesch Reading Ease for each year. (B) Same as A but for New Dale-Chall.
Figure 3.
Figure 3.. The decline in readability differs between scientific fields.
The random slopes for each journal were extracted from the best fitting linear mixed effect model (M2) and summarized according to which field they belong to (The error bars represent SE of the mean slope). Since some journals belong to more than one field, some random slopes appear in more than one summary. The trend of decreasing readability is not specific to any one field. (A) Summaries of random slopes for Flesch Reading Ease. (B) Summaries of random slopes for New Dale-Chall.
Figure 3—figure supplement 1.
Figure 3—figure supplement 1.. Most, but not all, journals have become less readable over time.
The random slopes for each journal were extracted from the best fitting linear mixed effect model (M2) and plotted according to rank. The trend of decreasing readability is present in most journals, although a few show an absence of a trend, and fewer still show increasing readability. (A) Journal random slopes for Flesch Reading Ease. (B) Journal random slopes for New Dale-Chall.
Figure 4.
Figure 4.. Readability of scientific abstracts correlates with readability of full texts.
(A) Schematic depicting the major steps in the full text extraction and analysis pipeline. (B) Relationship between Flesch Reading Ease (FRE) scores of abstracts and full texts across the full text corpus, depicted by a two-dimensional kernel density estimate. The color scale is exponential and represents the number of articles at each pixel. Axis limits are set to include at least 99% of the data. For New Dale-Chall (NDC) scores, see Figure 4—figure supplement 1. For each journal separately, see Figure 4—figure supplement 2.
Figure 4—figure supplement 1.
Figure 4—figure supplement 1.. New Dale-Chall abstracts and full text.
Relationship between New Dale-Chall Readability Formula scores of abstracts and full texts across the full text corpus, depicted by a two-dimensional kernel density estimate. Axis limits are set to include at least 99% of the data.
Figure 4—figure supplement 2.
Figure 4—figure supplement 2.. Correlations between readability metrics for abstracts and full texts from individual journals.
Relationship between both Flesch Reading Ease and New Dale-Chall Readability Formula scores of abstracts and full texts by journal, depicted by a two-dimensional kernel density estimate. Axis limits are set to include at least 99% of the data. Color scales are exponential and represent the number of articles at each pixel. FRE correlations (all p <10-15): eLife r = 0.54, 95% CI [0.51, 0.57], PLoS ONE r = 0.61, 95% CI [0.61, 0.61], PLoS Med r = 0.52, 95% CI [0.48, 0.56], PLoS Biol r = 0.49, 95% CI [0.46, 0.52], Genome Biol r = 0.51, 95% CI [0.48, 0.53], BMC Biol r = 0.57, 95% CI [0.52, 0.61]. NDC correlations (all p<10-15): eLife r = 0.56, 95% CI [0.53, 0.59], PLoS ONE r = 0.64, 95% CI [0.64, 0.64], PLoS Med r = 0.56, 95% CI [0.52, 0.60], PLoS Biol r = 0.52, 95% CI [0.49, 0.55], Genome Biol r = 0.44, 95% CI [0.41, 0.47], BMC Biol r = 0.57, 95% CI [0.52, 0.61].
Figure 5.
Figure 5.. Readability is affected by the number of authors.
(A) Proportion of number of authors per year for all articles in the abstract corpus. (B) Distributions of Flesch Reading Ease (FRE) scores for different numbers of authors (1-10). For New Dale-Chall (NDC), see Figure 5—figure supplement 1A (C) Mean FRE score for each year for different numbers of authors (1-10). For visualization purposes, bins with fewer than 10 abstracts are excluded. For NDC, see Figure 5—figure supplement 1B. Source data for this figure is available in Figure 2—source data 1.
Figure 5—figure supplement 1.
Figure 5—figure supplement 1.. New Dale-Chall for different number of authors.
(A) Distributions of New Dale-Chall Readability Formula scores for different numbers of authors. (B) Mean New Dale-Chall Readability Formula score for each year for different numbers of authors.
Figure 6.
Figure 6.. Readability is affected by general scientific jargon.
(A) Mean percentage of words in abstracts per year included in three different lists: science-specific common words (green, 2,949 words), general scientific jargon (blue, 2,138 words) and NDC common words (red, 2,949 words). (B) Example general science jargon words taken from the general scientific jargon list. Mean percentage of each word’s frequency in abstracts per year is shown.

Similar articles

Cited by

References

    1. Badarudeen S, Sabharwal S. Assessing readability of patient education materials: current role in orthopaedics. Clinical Orthopaedics and Related Research. 2010;468:2572–2580. doi: 10.1007/s11999-010-1380-y. - DOI - PMC - PubMed
    1. Bates D, Mächler M, Bolker B, Walker S. Fitting Linear Mixed-Effects Models using lme4. Journal of Statistical Software. 2014;67:51
    1. Begley CG, Ioannidis JP. Reproducibility in science: improving the standard for basic and preclinical research. Circulation Research. 2015;116:116–126. doi: 10.1161/CIRCRESAHA.114.303819. - DOI - PubMed
    1. Benjamin RG. Reconstructing readability: recent developments and recommendations in the analysis of text difficulty. Educational Psychology Review. 2012;24:63–88. doi: 10.1007/s10648-011-9181-8. - DOI
    1. Bird S, Klein E, Lower E, Loper E. Natural Language Processing with Python. Vol. 43. O’Reilly Media; 2009.