. 2017 Sep 5;15(9):e2002458.
doi: 10.1371/journal.pbio.2002458. eCollection 2017 Sep.

Identifying genetic variants that affect viability in large cohorts

Affiliations

Identifying genetic variants that affect viability in large cohorts

Hakhamanesh Mostafavi et al. PLoS Biol. .

Abstract

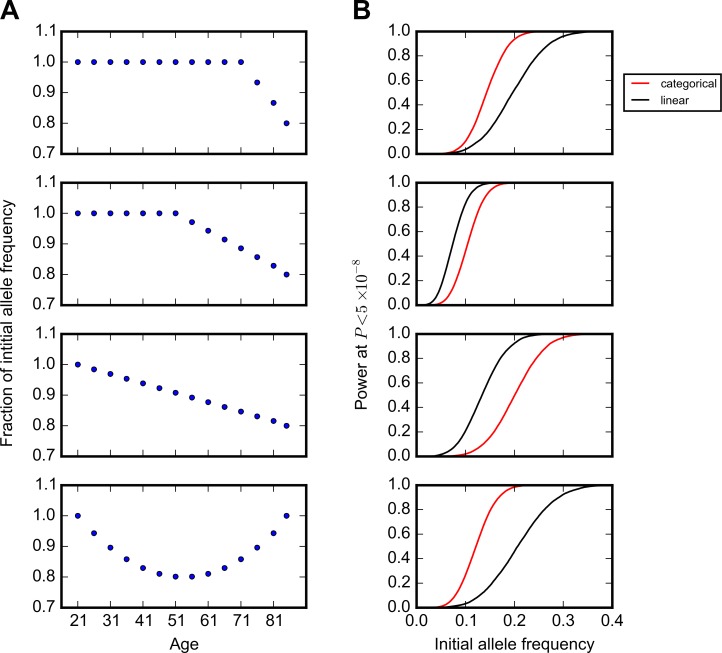
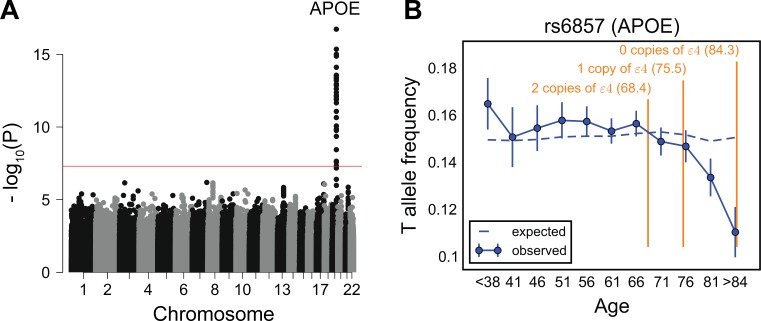
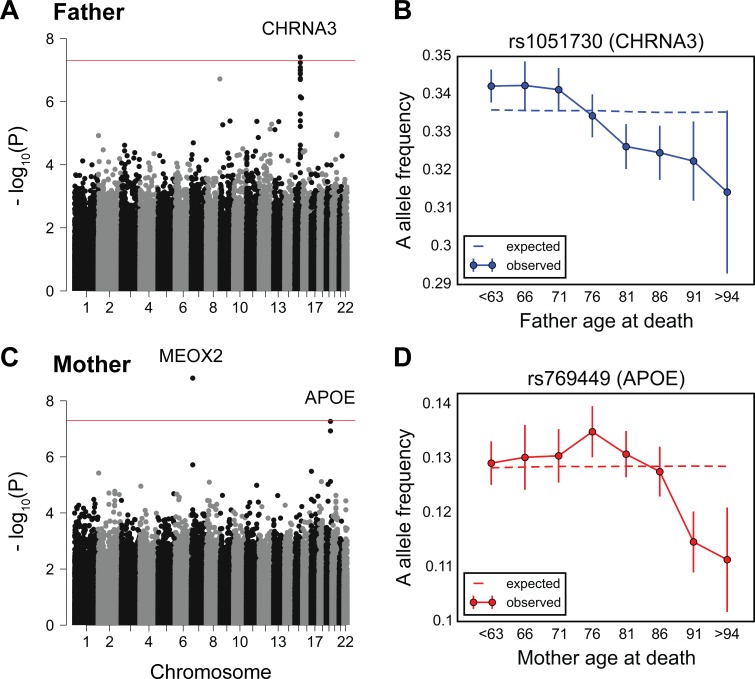
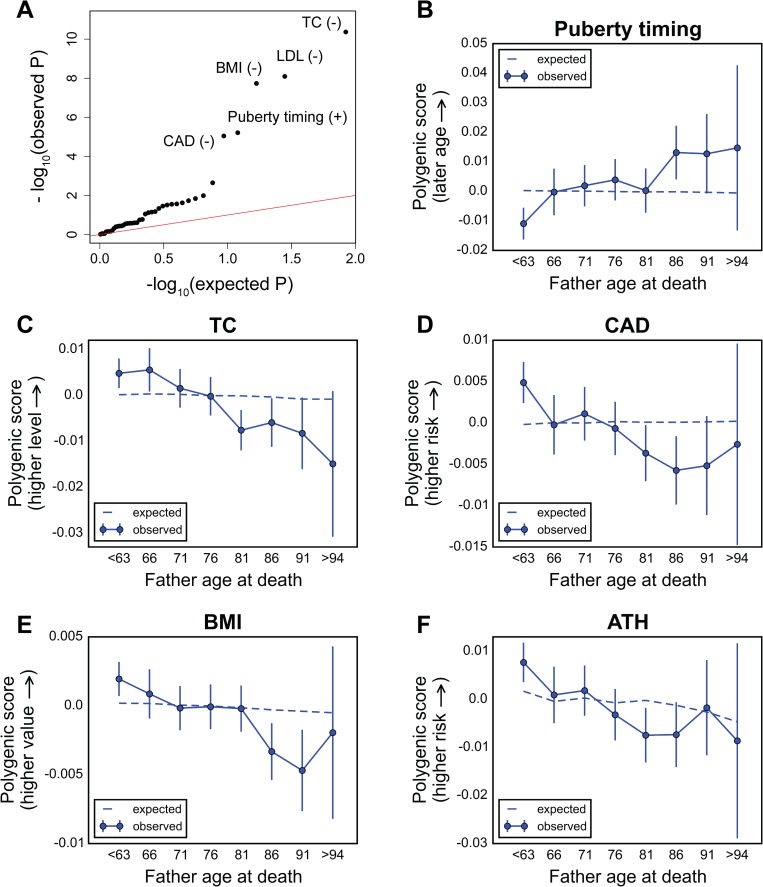
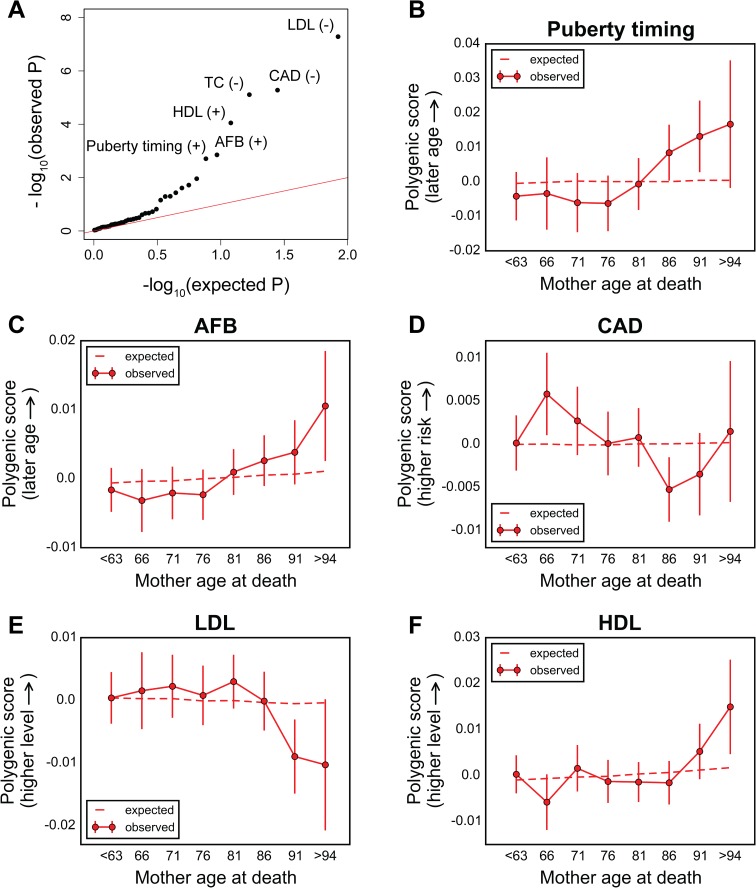
A number of open questions in human evolutionary genetics would become tractable if we were able to directly measure evolutionary fitness. As a step towards this goal, we developed a method to examine whether individual genetic variants, or sets of genetic variants, currently influence viability. The approach consists in testing whether the frequency of an allele varies across ages, accounting for variation in ancestry. We applied it to the Genetic Epidemiology Research on Adult Health and Aging (GERA) cohort and to the parents of participants in the UK Biobank. Across the genome, we found only a few common variants with large effects on age-specific mortality: tagging the APOE ε4 allele and near CHRNA3. These results suggest that when large, even late-onset effects are kept at low frequency by purifying selection. Testing viability effects of sets of genetic variants that jointly influence 1 of 42 traits, we detected a number of strong signals. In participants of the UK Biobank of British ancestry, we found that variants that delay puberty timing are associated with a longer parental life span (P~6.2 × 10⁻⁶ for fathers and P~2.0 × 10⁻³ for mothers), consistent with epidemiological studies. Similarly, variants associated with later age at first birth are associated with a longer maternal life span (P~1.4 × 10⁻³). Signals are also observed for variants influencing cholesterol levels, risk of coronary artery disease (CAD), body mass index, as well as risk of asthma. These signals exhibit consistent effects in the GERA cohort and among participants of the UK Biobank of non-British ancestry. We also found marked differences between males and females, most notably at the CHRNA3 locus, and variants associated with risk of CAD and cholesterol levels. Beyond our findings, the analysis serves as a proof of principle for how upcoming biomedical data sets can be used to learn about selection effects in contemporary humans.


Conflict of interest statement

The authors have declared that no competing interests exist.

Figures

Fig 1
Fig 1. Power of the model to detect changes in allele frequency with age.
(A) Trends in allele frequency with age considered in simulations. The y-axis indicates the allele frequency standardized to the frequency in the first age bin. (B) Power to detect the trends in (A) at P < 5 × 10⁻⁸, given the sample size per age bin in the Genetic Epidemiology Research on Adult Health and Aging (GERA) cohort (S2 Fig and total sample size of 57,696). Shown are results using models with age treated as a categorical (red) or an ordinal (black) variable, assuming no change in population structure and batch effects across age bins. The curves show simulation results sweeping allele frequency values with an increment value of 0.001 (1,000 simulations for each allele frequency) smoothed using a Savitzky-Golay filter in the SciPy package [43].
Fig 2
Fig 2. Testing for the influence of single genetic variants on age-specific mortality in the Genetic Epidemiology Research on Adult Health and Aging (GERA) cohort.
(A) Manhattan plot of P values for the change in allele frequency with age. The red line marks the P = 5 × 10⁻⁸ threshold. (B) Allele frequency trajectory of rs6857, a tag SNP for the APOE ε4 allele, with age. Data points are the frequencies of the risk allele within 5-year interval age bins (± 2 SE), with the center of the bin indicated on the x-axis (except for the first and the last points). Bins with ages below 38 years are merged into 1 bin because of the relatively small sample sizes. The dashed line shows the expected frequency based on the null model, accounting for confounding batch effects and changes in ancestry (see Materials and methods). In orange are the mean ages at onset of Alzheimer disease for carriers of 0, 1, or 2 copies of the APOE ε4 allele [53]. See S1 Data for underlying data.
Fig 3
Fig 3. Testing for the influence of single genetic variants on age-specific mortality in the UK Biobank.
(A) Manhattan plot of P values, obtained from testing for a change in allele frequency with age at death of fathers. (B) Allele frequency trajectory of rs1051730, within the CHRNA3 locus, with father’s age at death. (C) Manhattan plot of P values, obtained from testing for a change in allele frequency with age at death of mothers. (D) Allele frequency trajectory of rs769449, within the APOE locus, with mother’s age at death. Red lines in (A) and (C) mark the P = 5 × 10⁻⁸ threshold. Data points in (B) and (D) are the frequencies of the risk allele within 5-year interval age bins (± 2 SE), with the center of the bin indicated on the x-axis (except for the first and the last points). The dashed line shows the expected frequency based on the null model, accounting for confounding batch effects and changes in ancestry (see Materials and methods). See S2 Data for underlying data.
Fig 4
Fig 4. Testing for the influence of sets of trait-associated variants on survival of the fathers of UK Biobank participants.
(A) Quantile-quantile plot for association between the polygenic score of 42 traits (see S1 Table) with father’s survival, using the Cox model. The red line indicates the distribution of the P values under the null model. Signs “+” and “−” indicate protective and detrimental effects associated with higher values of polygenic scores, respectively. See S2 Table for P values and hazard ratios for all traits. (B–F) Trajectory of polygenic score with age at death of fathers for top traits associated with paternal survival (only independent signals are shown, see S20 Fig): puberty timing (using age at menarche-associated variants) in males (B), total cholesterol (TC) (C), coronary artery disease (CAD) (D), body mass index (BMI) (E), and asthma (ATH) (F). Data points in (B–F) are mean polygenic scores within 5-year interval age bins (± 2 SE), with the center of the bin indicated on the x-axis (except for the first and the last points). The dashed line shows the expected score based on the null model, accounting for confounding batch effects, changes in ancestry, and participant’s age, sex, year of birth, and the Townsend index (a measure of socioeconomic status). See S2 Data for underlying data.
Fig 5
Fig 5. Testing for the influence of sets of trait-associated variants on survival of the mothers of UK Biobank participants.
(A) Quantile-quantile plot for association between the polygenic score of 42 traits (see S1 Table) with mother’s survival, using the Cox model. The red line indicates the distribution of the P values under the null. Signs “+” and “−” indicate protective and detrimental effects associated with higher values of polygenic scores, respectively. See S2 Table for P values and hazard ratios for all traits. (B–F) Trajectory of polygenic score with age at death of mothers for top traits associated with maternal survival (only independent signals are shown, see S20 Fig): puberty timing (B), age at first birth (AFB) (C), coronary artery disease (CAD) (D), low-density lipoproteins (LDL) (E), and high-density lipoproteins (HDL) (F). Data points in (B–F) are mean polygenic scores within 5-year interval age bins (± 2 SE), with the center of the bin indicated on the x-axis (except for the first and the last points). The dashed line shows the expected score based on the null model, accounting for confounding batch effects, changes in ancestry, and participant’s age, sex, year of birth, and the Townsend index (a measure of socioeconomic status). See S2 Data for underlying data.

References

    1. Sabeti PC, Schaffner SF, Fry B, Lohmueller J, Varilly P, Shamovsky O, et al. Positive natural selection in the human lineage. Science. 2006;312(5780):1614–1620. doi: 10.1126/science.1124309 - DOI - PubMed
    1. Nielsen R, Hellmann I, Hubisz M, Bustamante C, Clark AG. Recent and ongoing selection in the human genome. Nat Rev Genet. 2007;8(11):857–868. doi: 10.1038/nrg2187 - DOI - PMC - PubMed
    1. Fu W, Akey JM. Selection and adaptation in the human genome. Annu Rev Genomics Hum Genet. 2013;14:467–489. doi: 10.1146/annurev-genom-091212-153509 - DOI - PubMed
    1. Mathieson I, Lazaridis I, Rohland N, Mallick S, Patterson N, Roodenberg SA, et al. Genome-wide patterns of selection in 230 ancient Eurasians. Nature. 2015;528(7583):499–503. doi: 10.1038/nature16152 - DOI - PMC - PubMed
    1. Yang Z, Bielawski JP. Statistical methods for detecting molecular adaptation. Trends Ecol Evol. 2000;15(12):496–503. - PMC - PubMed