Review
. 2018 Nov:93:2-15.
doi: 10.1016/j.jchemneu.2017.08.004. Epub 2017 Sep 2.

Myths and truths about the cellular composition of the human brain: A review of influential concepts

Affiliations
Review

Myths and truths about the cellular composition of the human brain: A review of influential concepts

Christopher S von Bartheld. J Chem Neuroanat. 2018 Nov.

Abstract

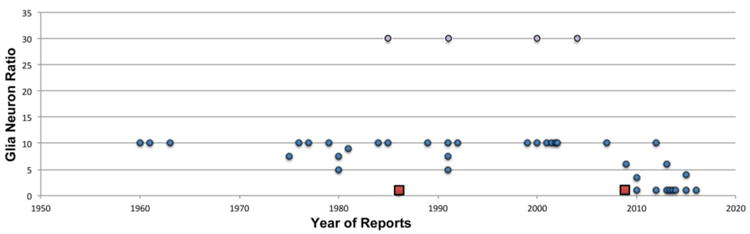
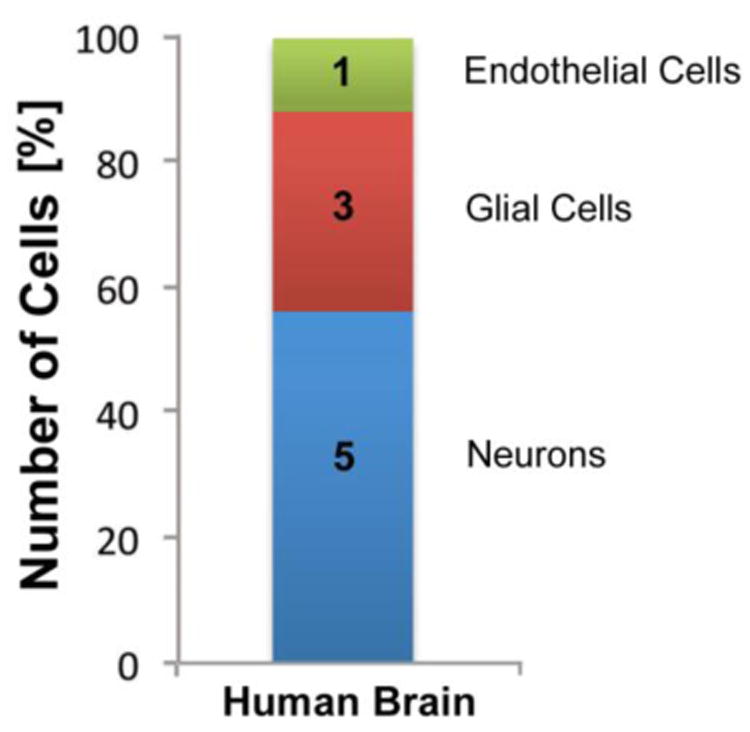
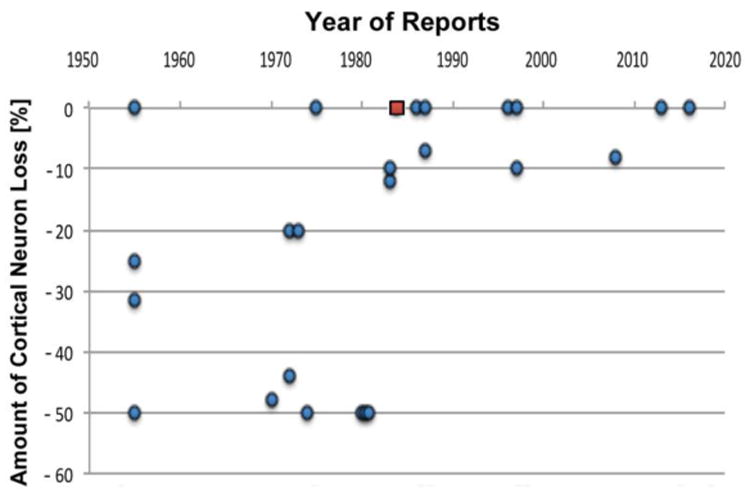
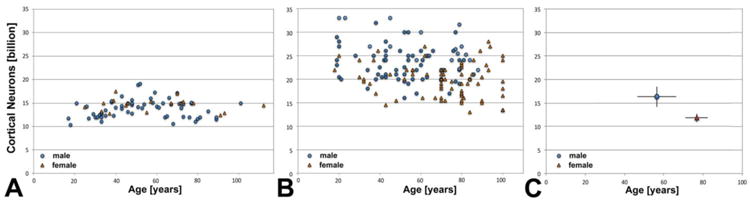
Over the last 50 years, quantitative methodology has made important contributions to our understanding of the cellular composition of the human brain. Not all of the concepts that emerged from quantitative studies have turned out to be true. Here, I examine the history and current status of some of the most influential notions. This includes claims of how many cells compose the human brain, and how different cell types contribute and in what ratios. Additional concepts entail whether we lose significant numbers of neurons with normal aging, whether chronic alcohol abuse contributes to cortical neuron loss, whether there are significant differences in the quantitative composition of cerebral cortex between male and female brains, whether superior intelligence in humans correlates with larger numbers of brain cells, and whether there are secular (generational) changes in neuron number. Do changes in cell number or changes in ratios of cell types accompany certain diseases, and should all counting methods, even the theoretically unbiased ones, be validated and calibrated? I here examine the origin and the current status of major influential concepts, and I review the evidence and arguments that have led to either confirmation or refutation of such concepts. I discuss the circumstances, assumptions and mindsets that perpetuated erroneous views, and the types of technological advances that have, in some cases, challenged longstanding ideas. I will acknowledge the roles of key proponents of influential concepts in the sometimes convoluted path towards recognition of the true cellular composition of the human brain.

Keywords: Aging; Cell counting; Glia neuron ratio; History; Human brain; Stereology.


Figures

Fig. 1
Fig. 1
Reports of the glia neuron ratio (GNR) in human brains from the 1960s to the current time. Note the obvious outliers by Kandel's and other's text books with a GNR of 30 (10–50), indicated by purple dots, and the pioneering reports of a GNR of 0.7–1 by Haug (1986), and by Azevedo et al. (2009) that used the isotropic fractionator, indicated by red squares. Data are compiled from the Table 5 published by von Bartheld et al. (2016).
Fig. 2
Fig. 2
A-C. Photographs of individuals who had a major influence on concepts regarding the cellular composition of the human brain. This composite shows the three main proponents of the 10:1 glia-neuron ratio and the notion of one trillion glia cells in the human brain. A. Holger Hydén was a professor at the University of Goteborg, Sweden, and the first to claim a 10:1 glia-neuron ratio in the 1960s (Hyden, 1960, 1967). Photo: Courtesy of Anders Hamberger, photography: Lennart Nilsson. Reproduced with permission. B. Stephen Kuffler, professor at Harvard and the “father of modern neuroscience,” was the first to promote the “at least 10:1 ratio” in his influential textbook in 1976 (Kuffler and Nicholls, 1976). Photo by Bachrach, Boston. Reproduced with permission. C. Eric Kandel, professor at Columbia University and Nobel laureate (2000), contributed to the perpetuation of the notion of one trillion glial cells by stating that glia outnumber neurons 10–50fold in his many editions of “Principles of Neural Science” – the “bible of neuroscience” visible in the bookshelf (Kandel and Schwarz, 1981 Kandel and Schwarz, 1985). Photo credit: Columbia University. Reproduced with permission.
Fig. 3
Fig. 3
A-C. Photographs of individuals who had a major influence on concepts regarding the cellular composition of the human brain. This composite shows the three main investigators who's work debunked several myths, including the claim of a 10:1 glia-neuron ratio and the trillion glia myth. A. Herbert Haug, professor at the University of Lübeck, Germany, correctly estimated in 1986 the glia-neuron ratio to be less than 1, based on his own cell counts, and he refuted the prevailing myth of neuronal fallout with normal aging. Photograph originally published by Wolfgang Kühnel (Annals of Anatomy, 185:293, 2003), and reproduced with permission by Elsevier. B. Bente Pakkenberg, professor at Bispebjerg University Hospital, Denmark, a pioneer in the use of stereological methods, determined cell numbers in numerous human brain structures, including cerebral cortex, cerebellum, and the effect of aging, diseases, and alcohol use on neuron numbers in human brains. Photograph by Claus Peuckert, claus peuckert photography, reproduced with permission. C. Suzana Herculano-Houzel, professor at Vanderbilt University, developed a highly efficient alternative counting method, the isotropic fractionator. Historically, this method was the first that revealed and effectively communicated the true number of non-neuronal cells and the true ratio of non-neuronal to neuronal cells in human brains. Photo credit: Luiza Herculano-Houzel. Reproduced with permission.
Fig. 4
Fig. 4
Cellular composition of the human brain: the concept of a 5:3:1 numerical ratio of neurons (blue), glial cells (red), and endothelial cells (green). Data and concept as originally designed in Bahney and von Bartheld (2017), and based on current estimates of the numbers of neurons, glia and endothelial cells (von Bartheld et al., 2016).
Fig. 5
Fig. 5
Reports of neuron death in the human cerebral cortex during normal aging. Note that in the 1950s through 1980s reports prevailed that claimed substantial neuron death (“neuronal fall-out”) during normal aging, until the report of Haug et al. (1984) (indicated with a red square) convincingly exposed this concept to be a technical artifact. It is now well established that there is no significant global cortical neuron loss with normal aging (see also Fig. 6).
Fig. 6
Fig. 6
A-C. Graphs of the number of cortical neurons in male and female brains with normal aging, based on one study using an early form of stereology (A), four studies using conventional stereology (B), and two studies using the isotropic fractionator (C). Comparison of the results of a total of seven studies: by Haug (1987) (A), (Braendgaard et al., 1990; Pakkenberg and Gundersen, 1997; Pelvig et al., 2008; Fabricius et al., 2013) (B), and the isotropic fractionator (IF) (Azevedo et al., 2009; Andrade-Moraes et al., 2013) (C). The bars in panel C denote ranges with n=4 for males, and n=5 for females; exact individual data points could not be shown for these two studies, because the data were reported only in aggregate in the original publications. Note that Haug's estimates correspond well in numbers with those obtained by the IF methodology, while the subsequent stereology estimates are somewhat higher. Note also that numbers do not decline significantly with age (panel A: y = 13.25 billion + 0.0099x for males, and y = 15.0 billion - 0.0071x for females), while in panel B the regression analyses show a minor decline of 2–4% (y = 24.6 billion - 0.0211x for males, and y = 21.7 billion - 0.0245x for females). The regression analysis is similar when up to seven possible duplicate data points are removed in panel B (because some of the same brains were used in multiple studies): y = 25.7 billion - 0.0336x for males, and y = 21.8 billion - 0.0266x for females, or when the very old females (ages 94–105) from the Fabricius et al. (2013) study are omitted (y = 21.5 billion - 0.0209x). Female numbers are significantly lower (by about 15–16%) than male numbers (p<0.0005), based on Gundersen and Pakkenberg's (1997) stereology work (panel B).

Similar articles

Cited by

References

    1. Abercrombie M. Estimation of nuclear population from microtome sections. Anat Rec. 1946;94:239–247. - PubMed
    1. Abusaad I, MacKay D, Zhao J, Stanford P, Collier DA, Everall IP. Stereological estimation of the total number of neurons in the murine hippocampus using the optical disector. J Comp Neurol. 1999;408:560–566. - PubMed
    1. Amaral DG, Schumann CM, Nordahl CW. Neuroanatomy of autism. Trends Neurosci. 2008;31:137–145. - PubMed
    1. Andersen BB, Gundersen HJ. Pronounced loss of cell nuclei and anisotropic deformation of thick sections. J Microsc. 1999;196:69–73. - PubMed
    1. Andersen BB, Korbo L, Pakkenberg B. A quantitative study of the human cerebellum with unbiased stereological techniques. J Comp Neurol. 1992;326:549–560. - PubMed

Publication types

LinkOut - more resources