Temporal phylogeography of Yersinia pestis in Madagascar: Insights into the long-term maintenance of plague
- PMID: 28873412
- PMCID: PMC5600411
- DOI: 10.1371/journal.pntd.0005887
Temporal phylogeography of Yersinia pestis in Madagascar: Insights into the long-term maintenance of plague
Abstract
Background: Yersinia pestis appears to be maintained in multiple, geographically separate, and phylogenetically distinct subpopulations within the highlands of Madagascar. However, the dynamics of these locally differentiated subpopulations through time are mostly unknown. To address that gap and further inform our understanding of plague epidemiology, we investigated the phylogeography of Y. pestis in Madagascar over an 18 year period.
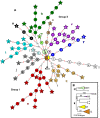
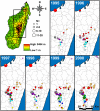
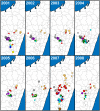
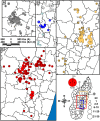
Methodology/principal findings: We generated whole genome sequences for 31 strains and discovered new SNPs that we used in conjunction with previously identified SNPs and variable-number tandem repeats (VNTRs) to genotype 773 Malagasy Y. pestis samples from 1995 to 2012. We mapped the locations where samples were obtained on a fine geographic scale to examine phylogeographic patterns through time. We identified 18 geographically separate and phylogenetically distinct subpopulations that display spatial and temporal stability, persisting in the same locations over a period of almost two decades. We found that geographic areas with higher levels of topographical relief are associated with greater levels of phylogenetic diversity and that sampling frequency can vary considerably among subpopulations and from year to year. We also found evidence of various Y. pestis dispersal events, including over long distances, but no evidence that any dispersal events resulted in successful establishment of a transferred genotype in a new location during the examined time period.
Conclusions/significance: Our analysis suggests that persistent endemic cycles of Y. pestis transmission within local areas are responsible for the long term maintenance of plague in Madagascar, rather than repeated episodes of wide scale epidemic spread. Landscape likely plays a role in maintaining Y. pestis subpopulations in Madagascar, with increased topographical relief associated with increased levels of localized differentiation. Local ecological factors likely affect the dynamics of individual subpopulations and the associated likelihood of observing human plague cases in a given year in a particular location.
Conflict of interest statement
The authors have declared that no competing interests exist.
Figures


Similar articles
-
Review of genotyping methods for Yersinia pestis in Madagascar.PLoS Negl Trop Dis. 2024 Jun 27;18(6):e0012252. doi: 10.1371/journal.pntd.0012252. eCollection 2024 Jun. PLoS Negl Trop Dis. 2024. PMID: 38935608 Free PMC article. Review.
-
Phylogeography and molecular epidemiology of Yersinia pestis in Madagascar.PLoS Negl Trop Dis. 2011 Sep;5(9):e1319. doi: 10.1371/journal.pntd.0001319. Epub 2011 Sep 13. PLoS Negl Trop Dis. 2011. PMID: 21931876 Free PMC article.
-
A decade of plague in Mahajanga, Madagascar: insights into the global maritime spread of pandemic plague.mBio. 2013 Feb 12;4(1):e00623-12. doi: 10.1128/mBio.00623-12. mBio. 2013. PMID: 23404402 Free PMC article.
-
A single introduction of Yersinia pestis to Brazil during the 3rd plague pandemic.PLoS One. 2019 Jan 9;14(1):e0209478. doi: 10.1371/journal.pone.0209478. eCollection 2019. PLoS One. 2019. PMID: 30625164 Free PMC article.
-
Plague in the genomic area.Clin Microbiol Infect. 2012 Mar;18(3):224-30. doi: 10.1111/j.1469-0691.2012.03774.x. Clin Microbiol Infect. 2012. PMID: 22369155 Review.
Cited by
-
Trends of Human Plague, Madagascar, 1998-2016.Emerg Infect Dis. 2019 Feb;25(2):220-228. doi: 10.3201/eid2502.171974. Emerg Infect Dis. 2019. PMID: 30666930 Free PMC article.
-
Review of genotyping methods for Yersinia pestis in Madagascar.PLoS Negl Trop Dis. 2024 Jun 27;18(6):e0012252. doi: 10.1371/journal.pntd.0012252. eCollection 2024 Jun. PLoS Negl Trop Dis. 2024. PMID: 38935608 Free PMC article. Review.
-
Oral Sylvatic Plague Vaccine Does Not Adequately Protect Prairie Dogs (Cynomys spp.) for Endangered Black-Footed Ferret (Mustela nigripes) Conservation.Vector Borne Zoonotic Dis. 2021 Dec;21(12):921-940. doi: 10.1089/vbz.2021.0049. Epub 2021 Nov 10. Vector Borne Zoonotic Dis. 2021. PMID: 34757815 Free PMC article.
-
Assembling a safe and effective toolbox for integrated flea control and plague mitigation: Fipronil experiments with prairie dogs.PLoS One. 2022 Aug 8;17(8):e0272419. doi: 10.1371/journal.pone.0272419. eCollection 2022. PLoS One. 2022. PMID: 35939486 Free PMC article.
-
Human plague: An old scourge that needs new answers.PLoS Negl Trop Dis. 2020 Aug 27;14(8):e0008251. doi: 10.1371/journal.pntd.0008251. eCollection 2020 Aug. PLoS Negl Trop Dis. 2020. PMID: 32853251 Free PMC article. Review.
References
-
- Rasmussen S, Allentoft ME, Nielsen K, Orlando L, Sikora M, Sjögren KG, et al. Early divergent strains of Yersinia pestis in Eurasia 5,000 years ago. Cell. 2015;163(3):571–82. doi: 10.1016/j.cell.2015.10.009 ;. - DOI - PMC - PubMed
-
- Cui Y, Yu C, Yan Y, Li D, Li Y, Jombart T, et al. Historical variations in mutation rate in an epidemic pathogen, Yersinia pestis. Proceedings of the National Academy of Sciences of the United States of America. 2013;110(2):577–82. Epub 2012/12/29. doi: 10.1073/pnas.1205750110 ;. - DOI - PMC - PubMed
-
- Morelli G, Song Y, Mazzoni CJ, Eppinger M, Roumagnac P, Wagner DM, et al. Yersinia pestis genome sequencing identifies patterns of global phylogenetic diversity. Nat Genet. 2010;42(12):1140–3. Epub 2010/11/03. doi: 10.1038/ng.705 . - DOI - PMC - PubMed
-
- Keim PS, Wagner DM. Humans and evolutionary and ecological forces shaped the phylogeography of recently emerged diseases. Nat Rev Microbiol. 2009;7(11):813–21. Epub 2009/10/13. doi: 10.1038/nrmicro2219 . - DOI - PMC - PubMed
MeSH terms
Grants and funding
LinkOut - more resources
Full Text Sources
Other Literature Sources
Medical
Miscellaneous

